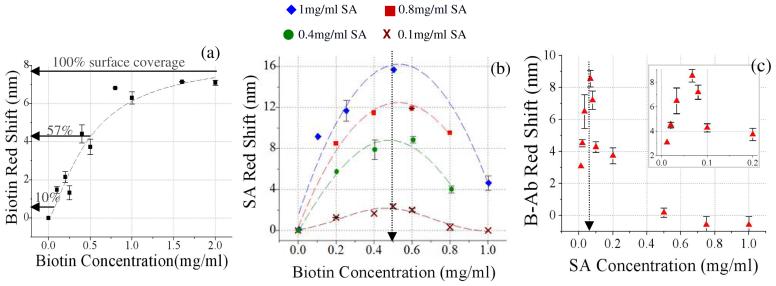
Figure 3.
(a) Biotin-LC-LC-NHS binding curve per concentration applied to sensor. (b) Red shift due to binding of SA for varying concentrations of biotin-LC-LC-NHS applied to sensor surface. Family of four curves due to various SA concentrations (0.1, 0.4, 0.8, 1.0 mg/ml) applied to sensor. (c) Red shift due to binding of biotinylated antibody receptor for varying concentrations of SA applied to sensor. (Biotin-LC-LC-NHS=0.5mg/ml, B-α-rabbit IgG= 0.5 mg ml-1)

