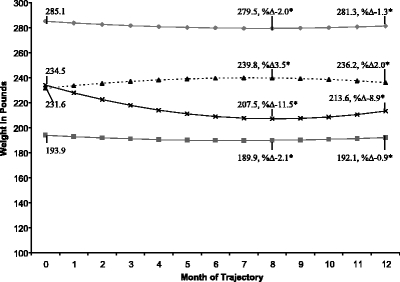
Figure 1.

The four dominant weight-change trajectories in the first year after new-onset diabetes type 2. Black diamonds = higher stable weight, n = 757; gray square = lower stable weight, n = 2,236; black triangle = weight gain, n = 664; black small letter “x” = weight loss, n = 478. *%Δ -Percentage change from baseline. All percentage changes (month 0 to month 8 and month 0 to month 12) are significantly different from zero (all p-values <0.001, based on Wilcoxon signed rank test). Equations: high stable: weight = 285.1 – 1.5 month + 0.1 month2, lower stable: weight = 193.9 – 1.2 month + 0.09 month2, weight gain: weight = 231.6 + 2.3 month - 0.2 month2, weight loss: weight = 234.5 – 6.7 month + 0.4 month2.
