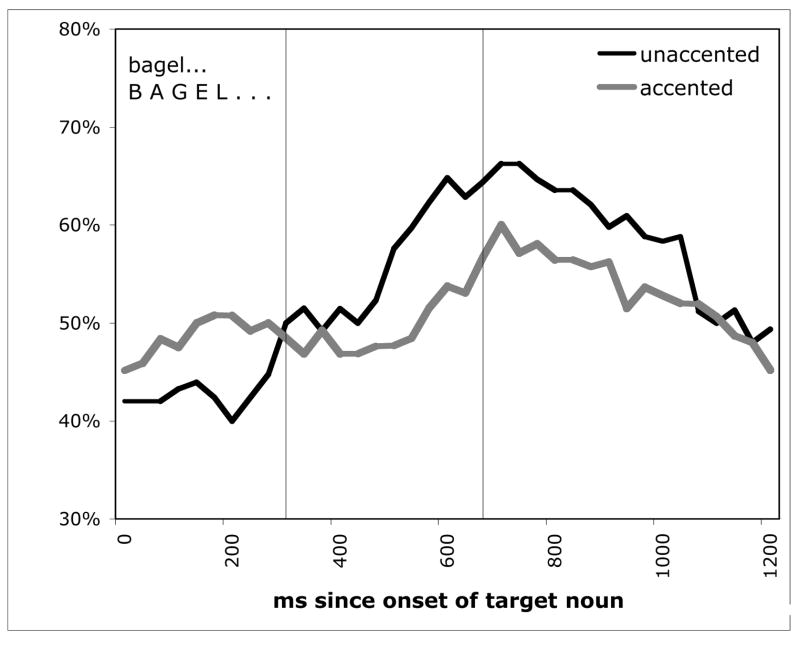
Figure 6.
Experiment 2 results: proportion looks to the target following unaccented (top panel) and accented nouns (bottom panel). The vertical line represents the average offset of the target word. The graph begins at the onset of the critical expression for each item. Proportions are calculated out of all looks, including trackloss.

