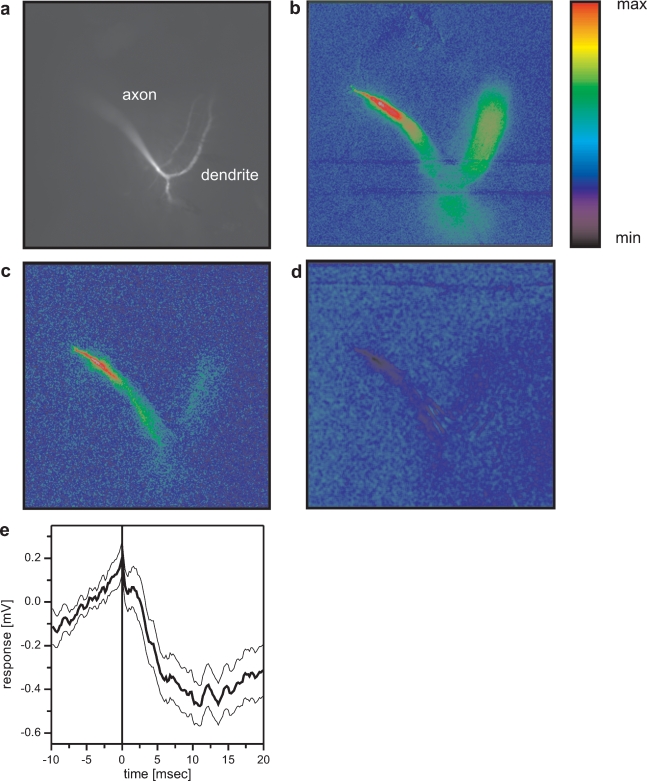
Figure 6.
Optical imaging of connectivity between VS cells. (a) Fluorescence image of a VS7 cell filled with OregonGreen Bapta I (OGB-I). (b) False-color images of relative change of fluorescence (ΔF/F) occurring in the VS7 cell after direct current injection of +10 nA into the VS7 cell. Color code: min = −10%, max = +30% ΔF/F. (c) False-color images of relative change of fluorescence (ΔF/F) occurring in the VS7 cell after current injection of +10 nA into VS6. Color code: min = −3%, max = +10% ΔF/F. The current injection into VS6 elicited an increase in fluorescence mainly in the terminal region of VS7. (d) False-color images of relative change of fluorescence (ΔF/F) occurring in the VS7 cell after current injection of +10 nA into VS1. Color code: min = −2.5%, max = +7.5% ΔF/F. Depolarizing current injection into VS1 elicited a decrease in fluorescence in VS7 again in the terminal region of the cell. This indicates that VS1 is inhibitory to VS7 and that the two cells are connected via axo-axonal contacts. For anatomical identification, VS1 and VS6 were filled with the calcium insensitive dye Alexa568. Since the FITC filter set was used for calcium imaging of VS7, VS1 and VS6 are not visible in the pictures with this filter set. (e) Spike-triggered average of VS7 membrane potential, where spikes occurring in VS1 served as a trigger signal. The averaged membrane potential of VS7 revealed a slow IPSP following a spike in VS1. The thick line shows the average potential (n = 112), the thin lines the mean ± SEM.

