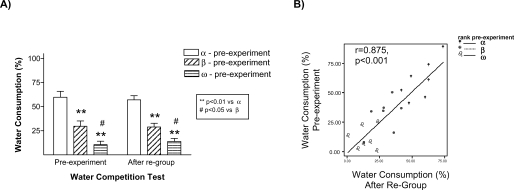
Figure 4.
Group-housed rats maintained their previous hierarchy status after being re-housed together once the social memory experiments were finished (day 8). In the left panel the graph represents the water consumption ratio average between group-cage rats during the WCT performed the week before the experiment started (pre-experiment) and when they were re-housed together after the WCT on day 8 (A). Rats with the highest ratio in time dedicated to water consumption during the WCT pre-experiment were identified as alpha (blank bars), those with the lowest ratio as omega (bars with horizontal lines), and the rats in between both types as beta (bars with slant lines). ** p < 0.01 vs. α-rats, # p < 0.05 vs. β-rats. On the right panel the relationship between the ratio of water consumption during WCT pre-experiment and after re-group is represented (B). Equivalent hierarchy status was observed in homecage-based WCTs delivered before or after the “social memory” experimental procedures.

