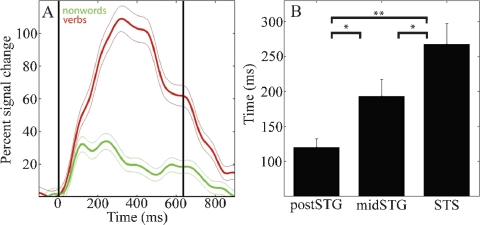
Figure 2.
(A) Mean (±SE) percent signal change of HG analytic amplitude for verbs (red) and nonwords (green) for an electrode over the STS in patient A (49, see Figure 4A for location). Black vertical lines indicate onset and offset of verb stimulus. (B) Processing of words as opposed to acoustically matched nonwords sequentially activates the post-STG, then the mid-STG, followed by the STS. Mean (±SE) onset time of significantly different HG activity for words versus acoustically matched nonwords in post-STG, mid-STG, and STS. (*: p < 0.05; **: p < 0.001, FDR corrected). (HG, 80–200 Hz) is the most effective frequency band for the temporal tracking of cortical activity associated with word processing.

