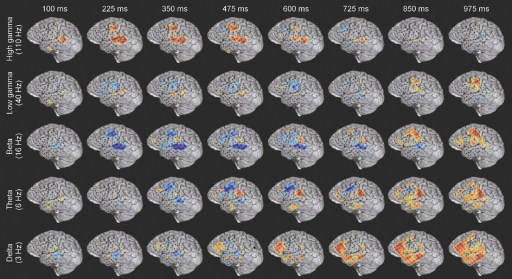
Figure 3.
Example of the spatiotemporally complex oscillatory dynamics associated with verb processing. Spatial pattern of power changes in different frequency bands at successive times in response to verb presentation in subject A (see Figure 4A for electrode locations on MRI rendering and methods for MNI coordinates). Red indicates power increase and blue indicates power decrease. HG activity along the STG and STS has an early, strong onset, and in this subject is accompanied by activation of premotor regions. An initial beta power decrease occurs at and surrounding regions of strong HG activity, but note the late (850–975 ms) beta power increase over motor areas. Theta power shows a transient power decrease over premotor/frontal areas (350–725 ms) and a late onset power increase over the inferior parietal lobule (e.g., 600–975 ms). Delta activity is late and spatially diffuse over prefrontal and middle temporal regions. Note that power changes in different frequency bands are active in overlapping but distinct cortical territories, and show distinct temporal patterns of onset, duration, and offset.

