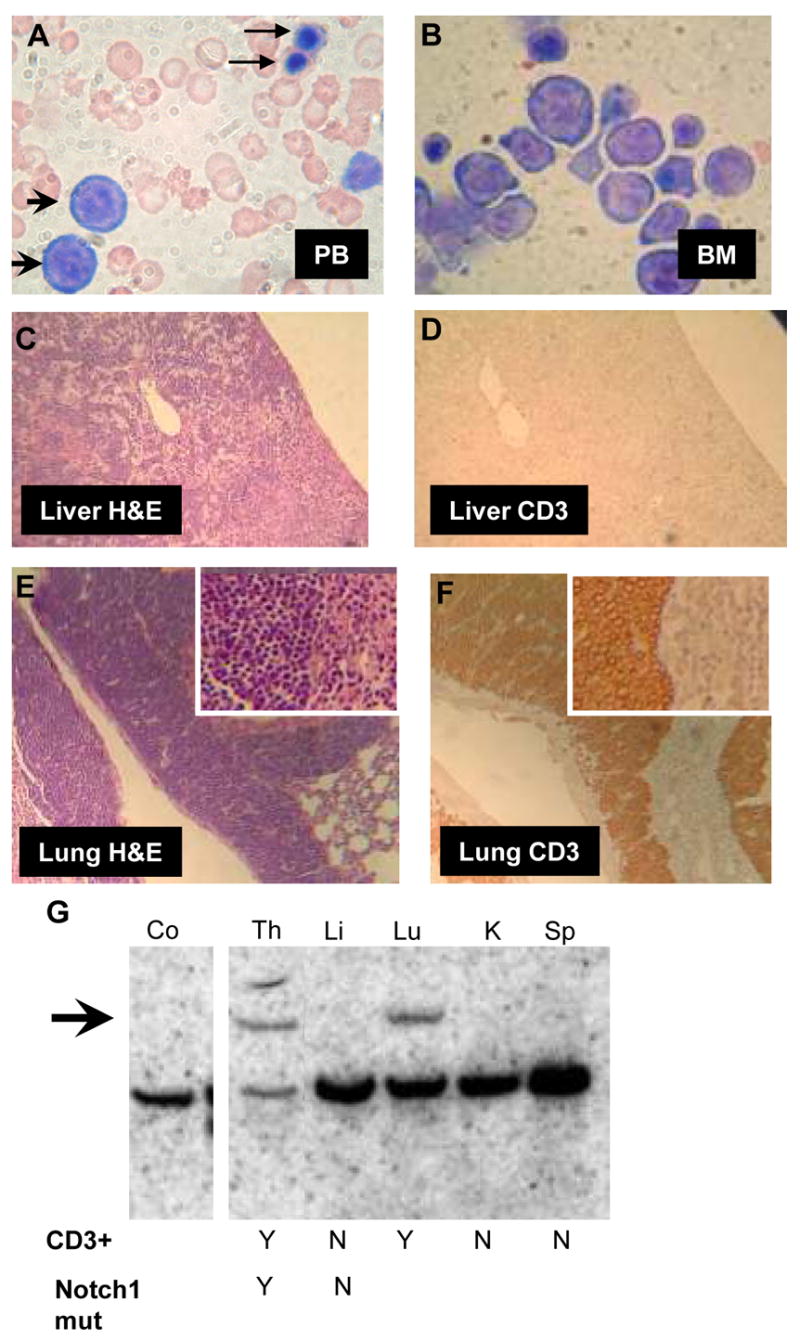
Figure 2. Concurrent erythroid and pre-T leukemia in NHD13 mouse 1018.

A and B, peripheral blood (A) and bone marrow (B) demonstrating circulating erythroblasts (arrowheads), nucleated red blood cells (arrows), and replacement of bone marrow with erythroblasts (original magnification × 1000). C and D, section of liver infiltrated with leukemic blasts, stained with H&E (C) or anti-CD3 (D) (original magnification × 100). Note lack of CD3 staining in liver. E and F, section of lung infiltrated with leukemic blasts, stained with H&E (E) or anti-CD3 (F). Note strong CD3 staining in lung (original magnification × 100; inset × 400). (G) Southern blot of leukemic tissue hybridized to a TCRB probe. Note germline band in all lanes, and a clonal rearranged band in the Th and Lu (arrow). CD3 staining and presence of Notch1 mutation in infiltrated tissues is indicated as yes (Y) or no (N). Co, non-transgenic control; Th, thymus; Li, liver; Lu, lung; K, kidney; Sp, spleen.
