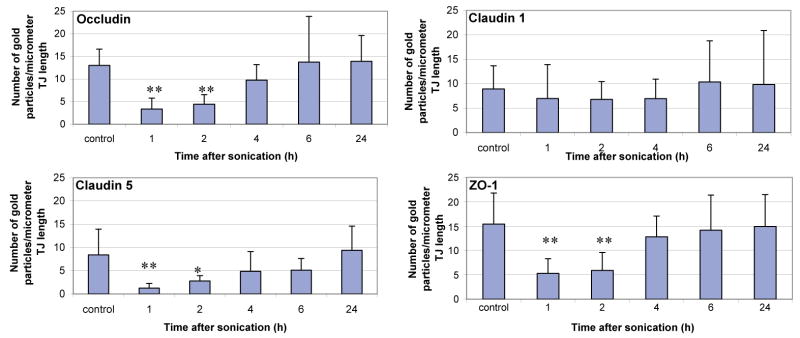
Fig. 8.
Immunoelectron microscopic expression of the tight junction proteins at different time-intervals after sonication. The histograms show the mean number of the colloidal-gold particles count per micrometer of interendothelial cleft. Ten clefts for each value were examined, and the mean densities from each time-interval after sonication were compared with the controls. Statistically significant differences are marked with asterisks (*P<0.05; **P<0.01).

