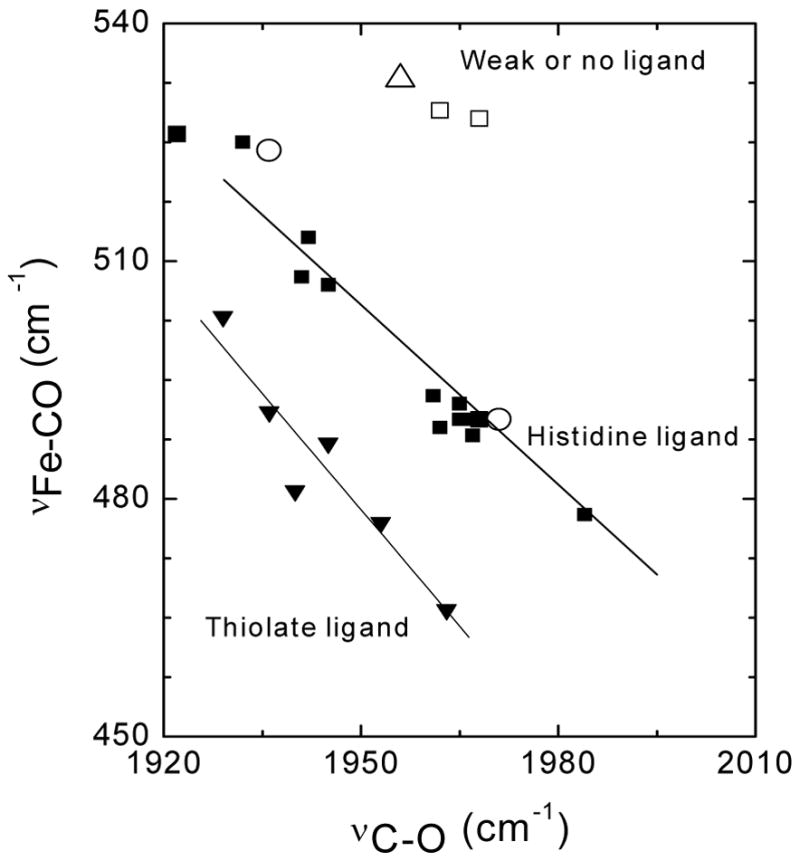
FIGURE 7.

ν(C-O) versus ν(Fe-CO) plots of hemoprotein-CO complexes. Data points for wt DevS642 (○) and H149A (△) are compared with values for wt and distal mutants of myoglobin from (64) (◆), and from cytochrome P450 and NO synthase (←) (36, 68). Also shown are proximal histidine mutants of heme oxygenase (□) (29, 30).
