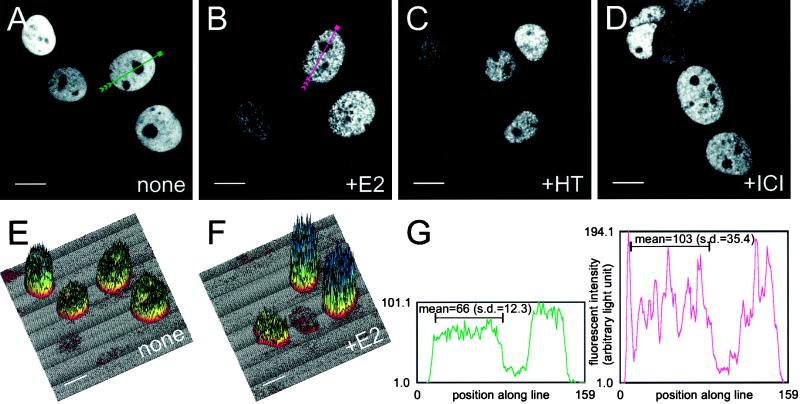
Figure 4.
Effect of ligand treatment on the intranuclear distribution of GFP-ER in MCF-7 cells. MCF-7 cells were electroporated with 0.2 μg of GFP-ER expression plasmid pCI-nGL1-HEGO and cultured on coverslips overnight. The next day, media were changed, and the cells were treated with nothing (A), 10 nM 17β-estradiol (B), 10 nM 4-hydroxytamoxifen (C), or 10 nM ICI 182780 (D) for 1 h before visualization by confocal laser scanning microscopy on a Bio-Rad MRC 1024 system. Representation of fluorescence intensity in A and B is as three-dimensional plots in E and F, respectively, with the greater the fluorescence, the higher the peaks, and the cooler the colors. Bar, 10 μm. (G) Graph of fluorescence intensity along the green line for the nucleus in A (left graph with green curve) and red line for the nucleus in B (right graph with red curve). Arrowheads in A and B point to the direction of the plot from left to right in H. The black bar within each graph in H marks the segment of the line for which the mean fluorescence intensity and SDs are calculated.

