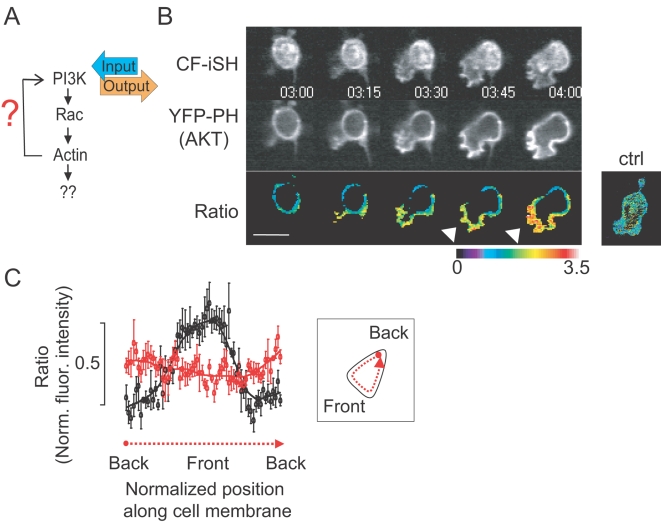
Figure 5. Delayed triggering of PIP3 polarization after an initial non-uniform increase in PIP3.
(A) Schematic representation of experiments conducted in (B) and (C). (B) Time series analysis of PIP3 accumulation at the front of a migrating cell following uniform activation of PI3K in an unpolarized cell. Shown cell expresses the PI3K activator (CF-iSH, top row) and the PIP3 biosensor (YFP-PH(AKT), middle row). Bottom images were produced by ratioing the YFP-PH(AKT) images over the CF-iSH image. Note the higher ratio value at the pseudopod of the emerging polarized cells (arrowheads). The control panel on the right shows a ratio image of a cell expressing CF-iSH over a generic plasma membrane marker (myristoylated- and palmitoylated-YFP), arguing that CF-iSH is itself suitable as a uniform PM marker. Time unit; minute and second. (C) Line-scan analysis of the ratio images shown in (B) and of a control cell where a PM-YFP was again used instead of the YFP-PH(AKT). Normalized ratio values within a peri-plasma membrane region were calculated for the PI3K activated cells (analysis scheme is shown in inset). Black lines represent the normalized YFP-PH(AKT) distribution and red lines the control experiments showing that the normalization technique takes into account differences in membrane concentration. Error bars are given in S.E.M. (n = 5). Scale bars, 10 µm.

