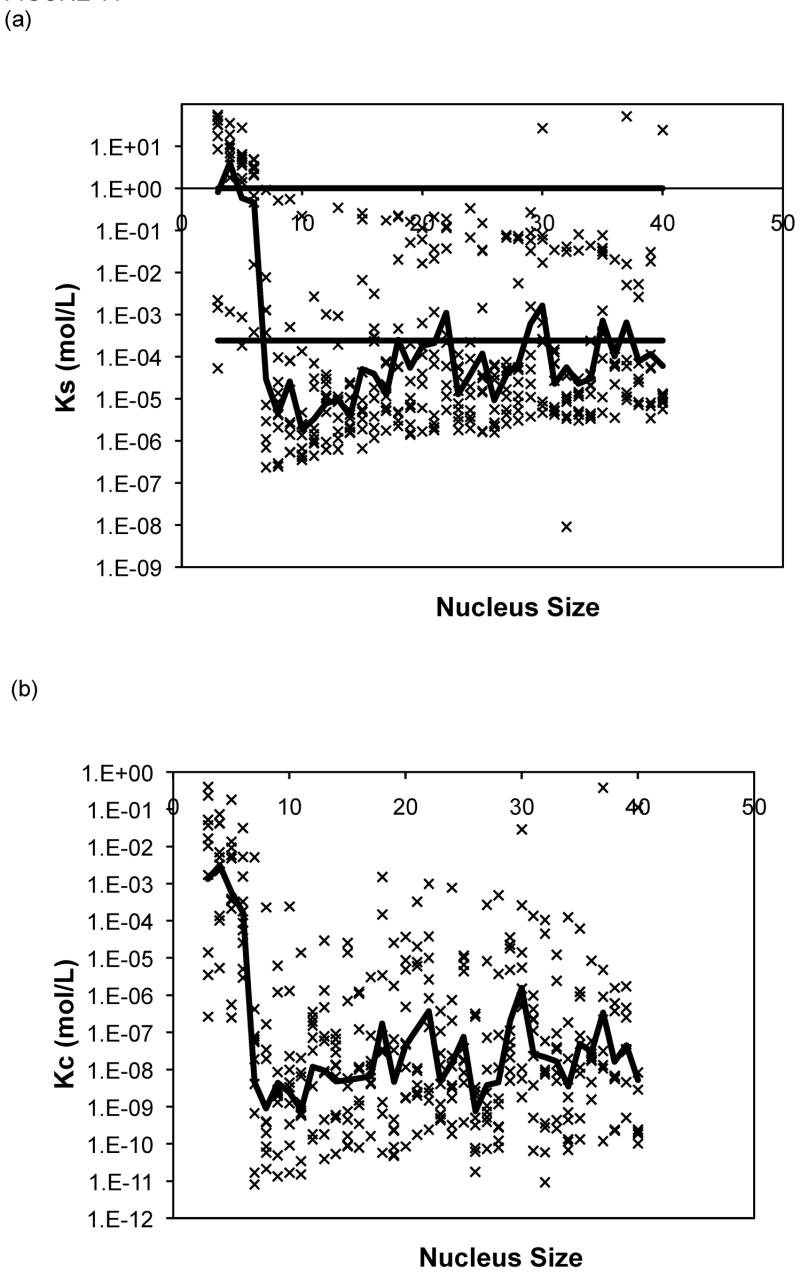
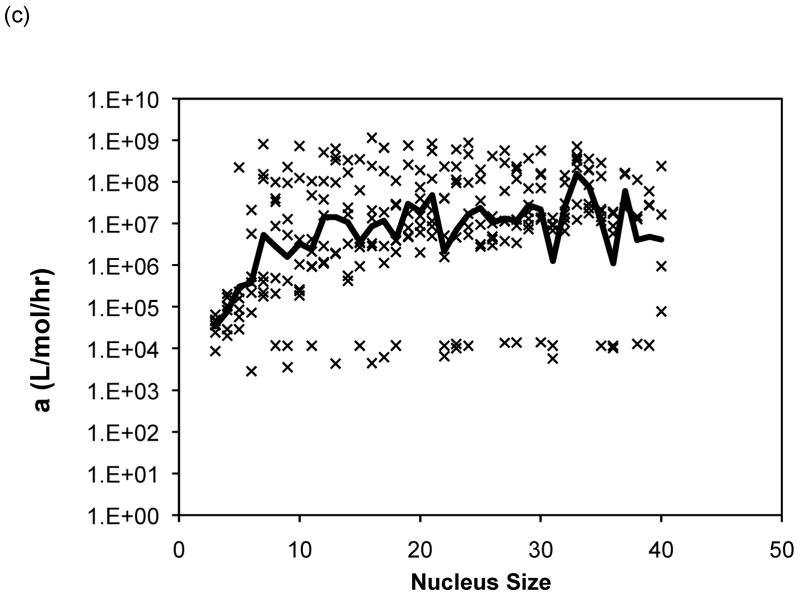
Figure 11.
Optimized kinetic parameters as a function of nucleus size using the Powers model for PE at pH~4.1 in 50mM salts of (a) Ks, (b) Kc, and (c) forward rate constant, a. Symbols are for different data sets. The black lines are the average values. For Ks, the semi-transparent lines are for Ks=1 and Ks=Xtot0.


