
Figure 12.
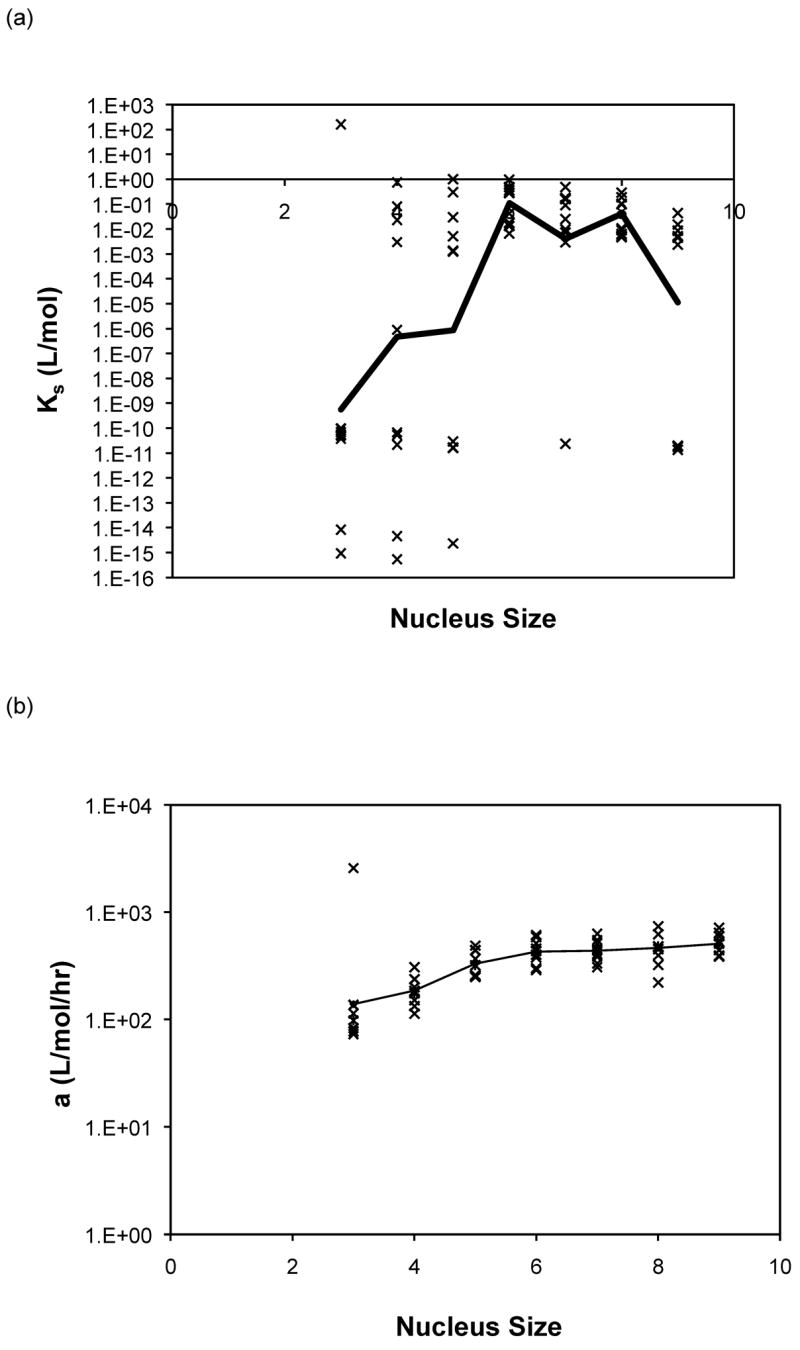
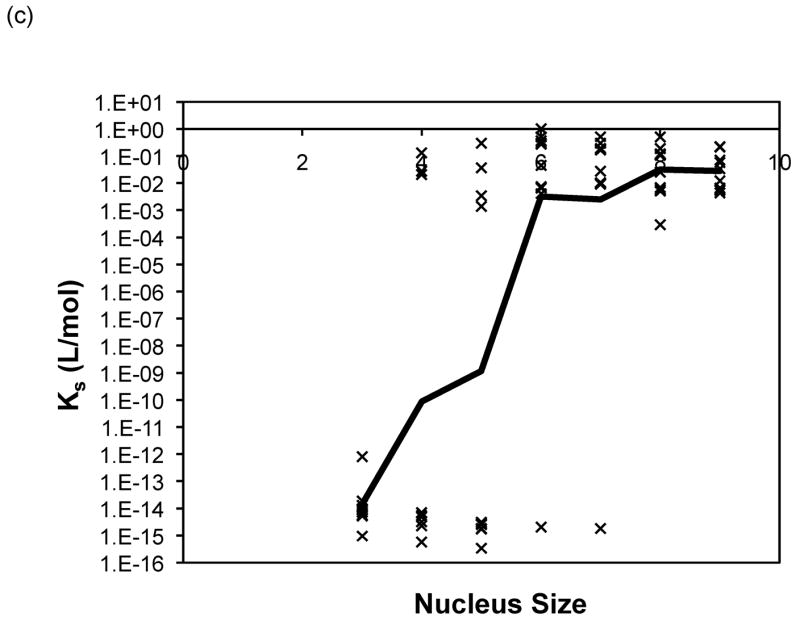

Optimized kinetic parameters as a function of nucleus size using the modified nucleated polymerization model for PE at pH~4.1 in 50mM salts. The top row presents (a) Kc and (b) forward rate constant, a, for the constant rate model, and the bottom row presents (c) Kc and (d) forward rate constant, a, for the variable rate model. Symbols are for different data sets. The black lines are the average values.