
Figure 13.
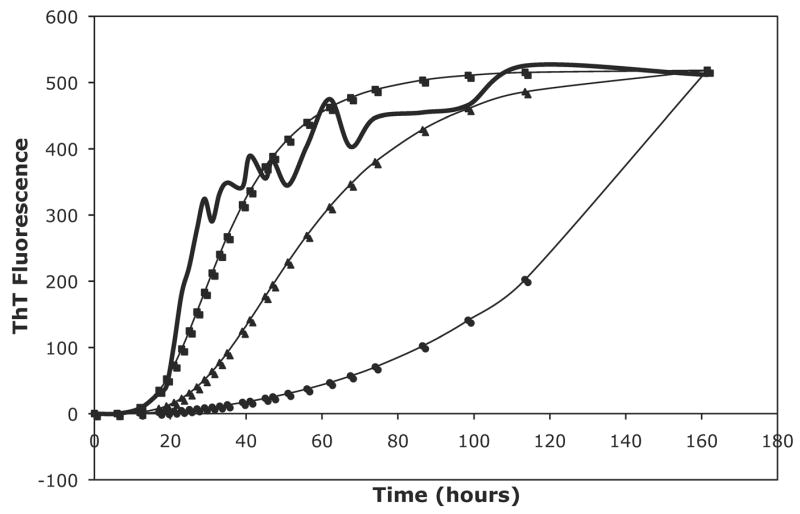
A comparison of the Powers & Powers model to both the constant and variable modified nucleated polymerization (NP) models with the same kinetic parameters. For this comparison, a nucleus size of 8 was assumed, a = 3.49e2, b = 3.05, and c = 0. The raw data is for PE grown in 50mM potassium nitrate at pH~4.1. The thick black line is the ThT fluorescence data, the squares are for the variable rate modified NP model, the triangles are for the constant rate NP model, and the circles are for the Powers & Powers model.