
Figure 2.
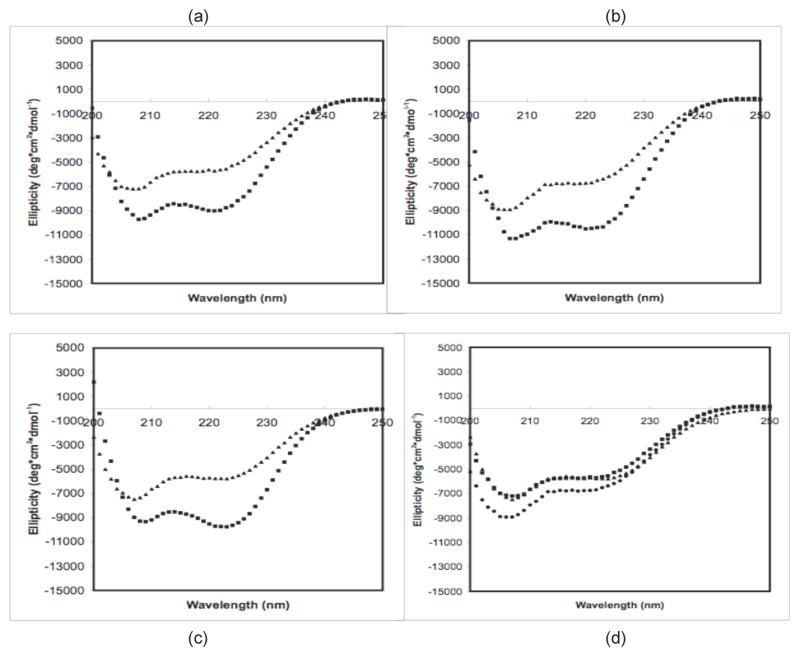
CD Spectra of 0.5mg/mL polypeptides in 25mM sodium propionate for (a) PE at pH~3.6, (b) PE at pH~4.1, (c) PEA at pH~3.6, and (d) PE and PEA at 65°C. For (a)–(c), squares are at 25°C, and triangles are at 65°C. For d, squares are for PE at pH~3.6, circles are for PE at pH~4.1, and triangles are for PEA at pH~3.6.