
Figure 3.
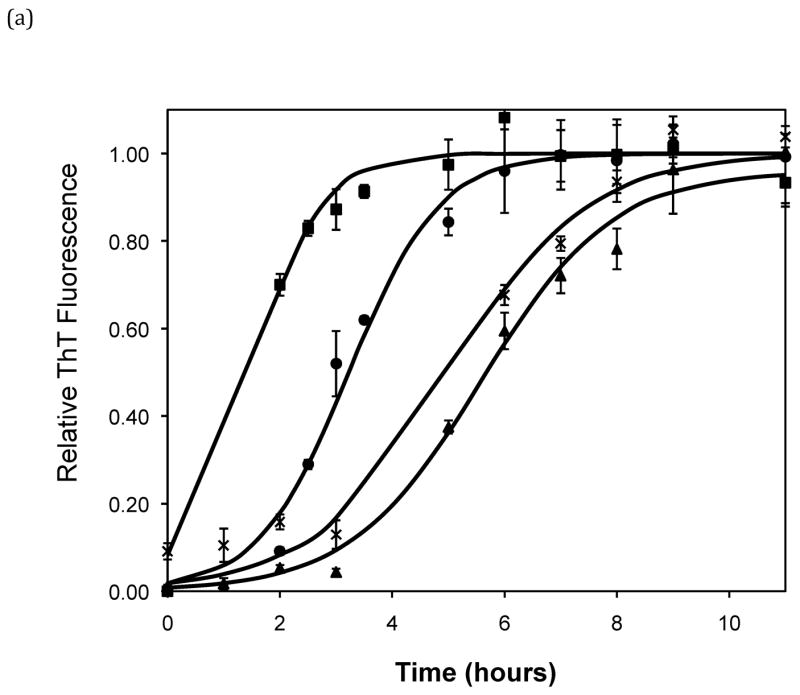
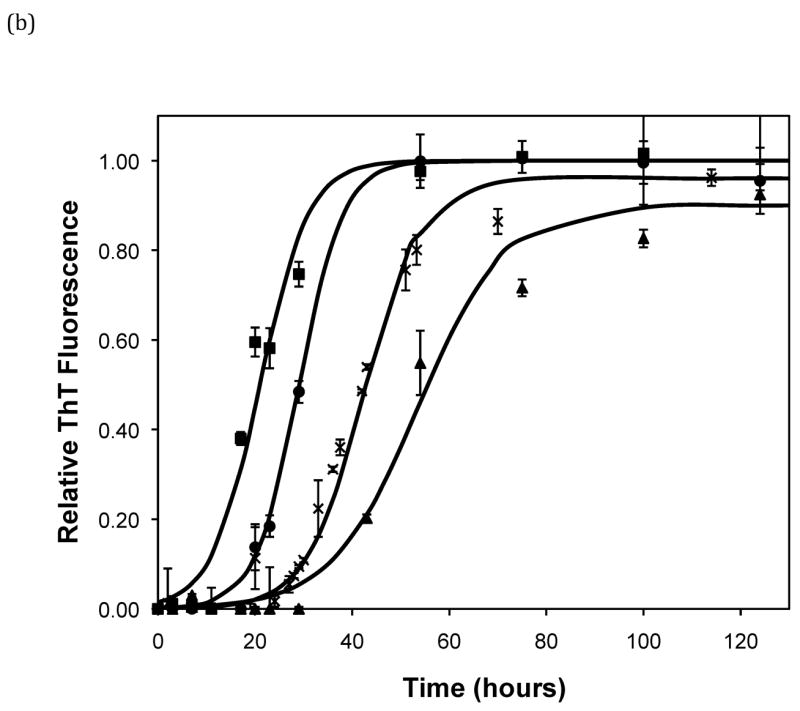
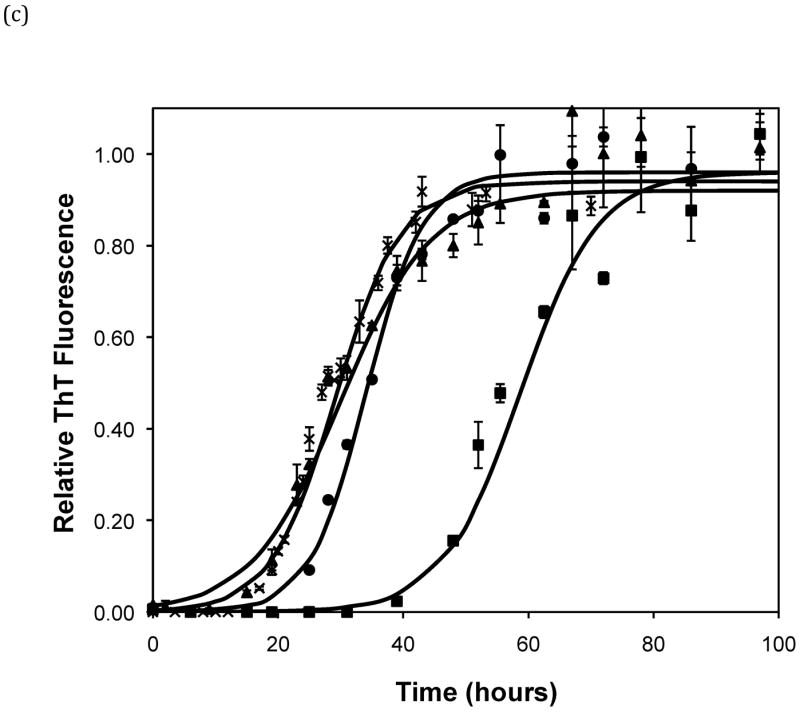
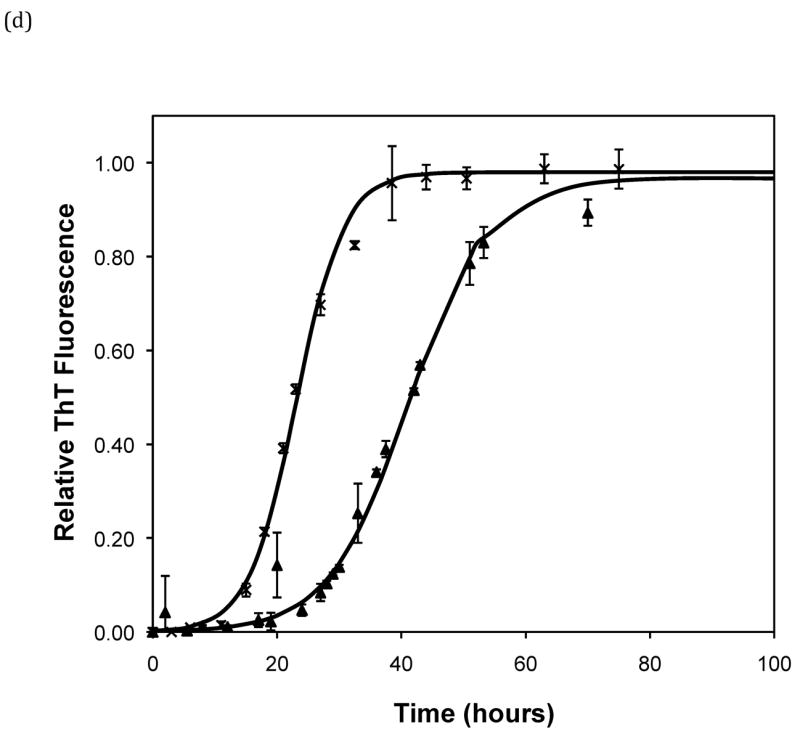
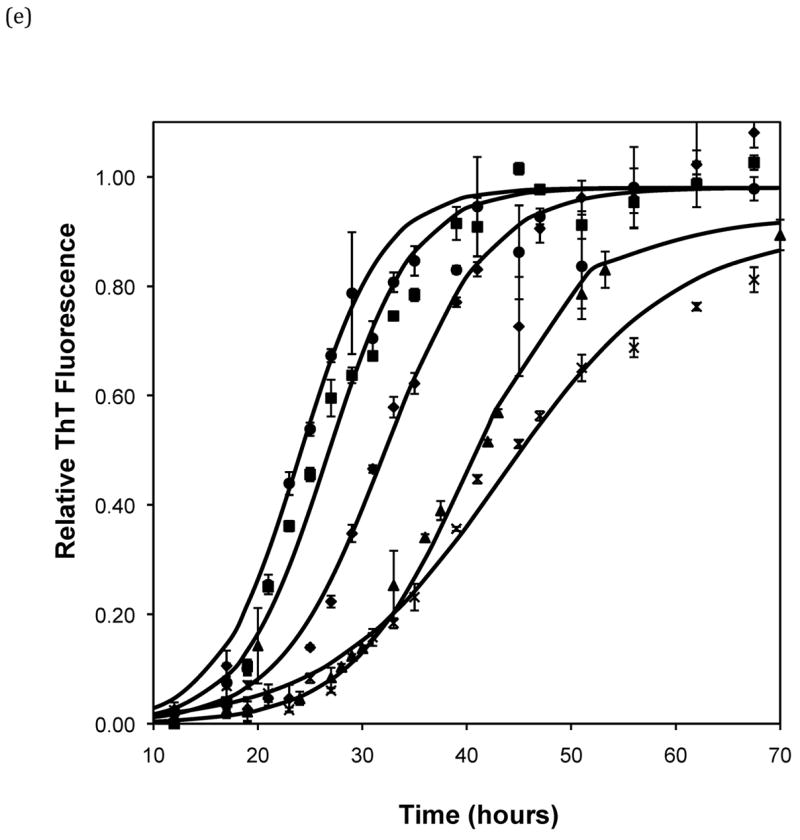
Effect of salt type, concentration, and seeding on polypeptide aggregation. Polypeptide aggregation as a function of salt concentration in sodium acetate for (a) PE at pH~3.6, (b) PE at pH~4.1, and (c) PEA at pH~3.6. Squares are no salt, circles are 10mM, crosses are 50mM, triangles are 100mM.(d) PE pH~4.1 as a function of seeding in 50mM sodium acetate. Crosses are seeded, triangles are unseeded.(e) PE in 50mM salt at pH~4.1. Circles are KNO3, squares are K2HPO4, diamonds are NaNO3, triangles are NaAc, and crosses are MgSO4. Solid fit lines for (a)–(d) are based on a hyperbolic tangent with the center shifted from the origin.