
Figure 5.


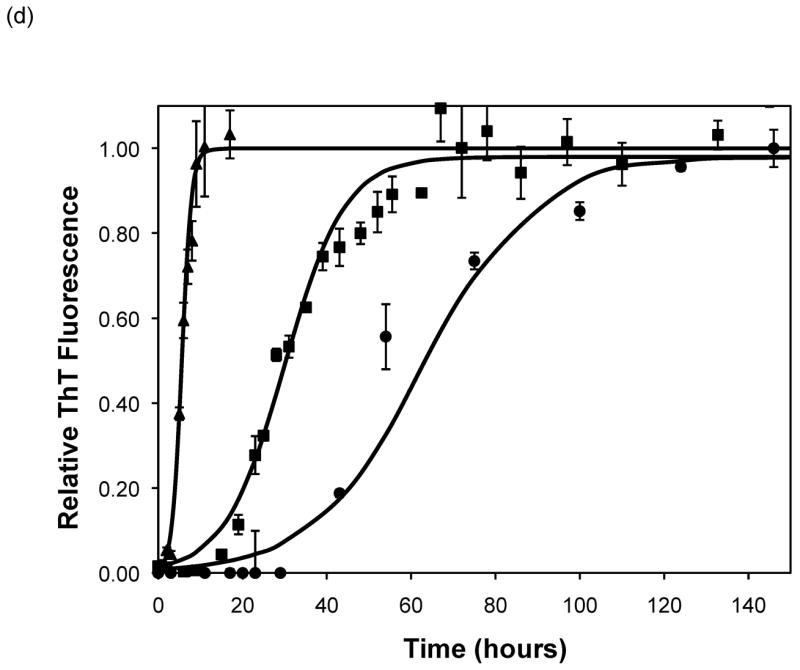
Polypeptide aggregation in different concentrations of sodium acetate.(a) no salt, (b) 10mM, (c) 50mM, and (d) 100mM. Squares are PEA at pH~3.6, circles are PE at pH~4.1, triangles are PE at pH~3.6. Solid fit lines for a–d are based on a hyperbolic tangent with the center shifted from the origin.