
Figure 8.
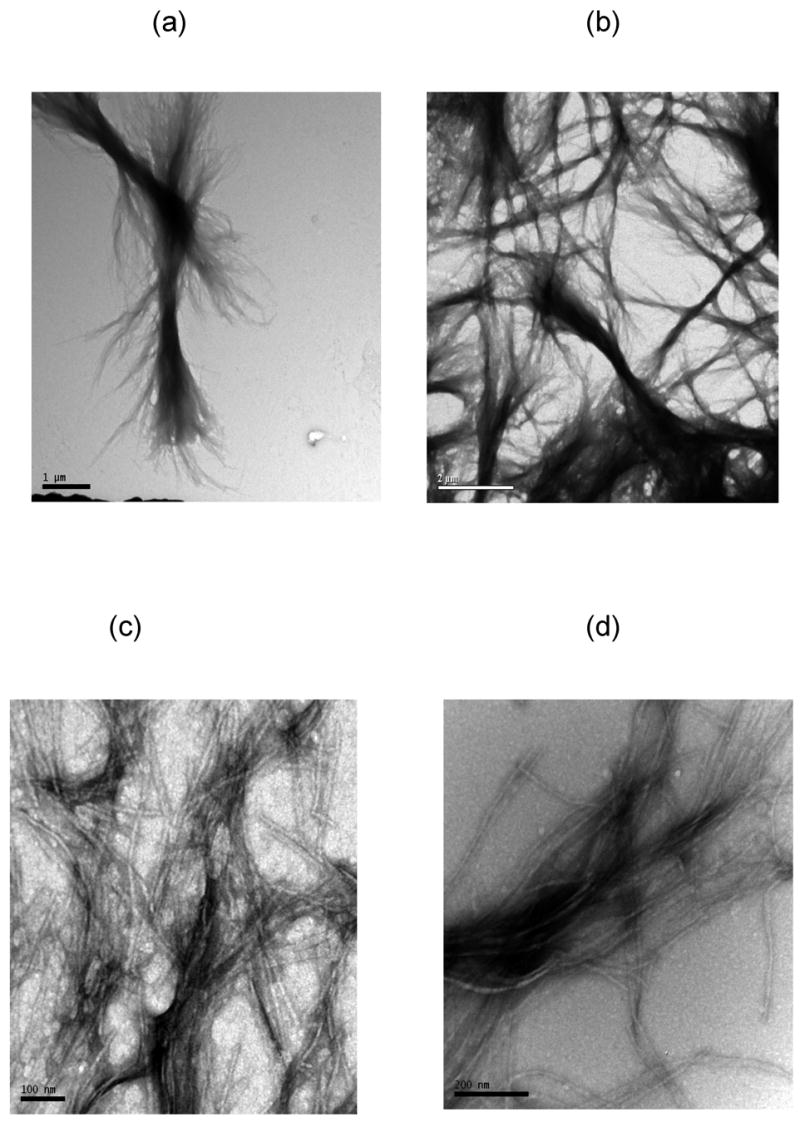
TEM images of UA-stained PEA fibrils at pH~3.6 in (a) 100mM, (b) 50mM, (c) 10mM, (d) 0mM sodium acetate. Scale bars are 1μm, 2μm, 100nm, 200nm for (a)–(d), respectively.
Official websites use .gov
A
.gov website belongs to an official
government organization in the United States.
Secure .gov websites use HTTPS
A lock (
) or https:// means you've safely
connected to the .gov website. Share sensitive
information only on official, secure websites.
TEM images of UA-stained PEA fibrils at pH~3.6 in (a) 100mM, (b) 50mM, (c) 10mM, (d) 0mM sodium acetate. Scale bars are 1μm, 2μm, 100nm, 200nm for (a)–(d), respectively.