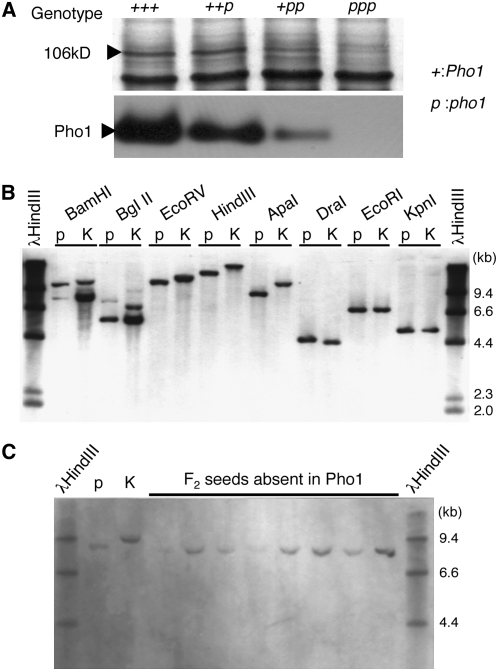
Figure 4.
Genetic Analysis of the pho1 Mutation in Rice.
(A) Gene dosage effects of pho1 mutation on protein amount (top) and activity (bottom) of plastidic α-glucan Pho in rice endosperm. “+” and “p” tentatively represent a wild-type and mutant gene, respectively. Since the endosperm has a gene dosage of 3, the genotypes of the wild type (T65), F1 derived from a cross between a T65 female parent and a EM755 male parent, F1 from a cross between a EM755 female parent and a T65 male parent, and a pho1 mutant (EM755) are represented as “+++,” “++p,” “+pp,” and “ppp”, respectively. Pho1 protein amounts were detected by SDS-PAGE of protein extracted from respective mature seeds. The activity of Pho1 was measured by native-PAGE/enzymatic activity staining analysis.
(B) RFLP analysis of the Pho1 gene. The Pho1 digestion products were detected by DNA gel blot analysis using DNA prepared from leaf blades of the pho1 mutant EM755 (p) and of an indica rice cultivar Kasalath (K).
(C) Segregation of an RFLP marker in homozygous pho1/pho1 F3 plants. DNA from pho1/pho1 F3 plants (p), which were selected by SDS-PAGE analysis, was digested with ApaI. K represents DNA from the Kasalath cultivar that underwent the same digestion analysis.

