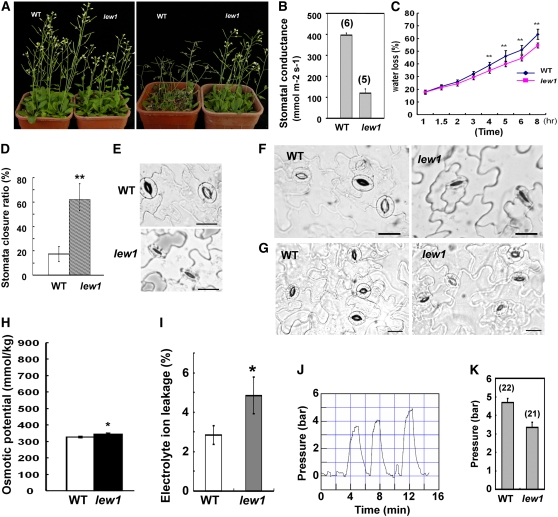
Figure 2.
Analysis of Drought Resistance and Related Parameters in lew1.
(A) Comparison of wild-type and lew1 plant growth under normal (left) and drought stress (right) conditions. For drought treatment, 3-week-old seedlings were subjected to water withholding for 2 weeks.
(B) Stomatal conductance in the wild type and lew1. Data are means ± se. The numbers in parentheses indicate the numbers of analyzed plants. Two to four leaves were used per plant for the wild type, and one to two leaves were used per plant for lew1.
(C) Water loss from detached leaves. Three independent experiments were performed, and 15 leaves per genotype were used in each experiment. Data are means ± se (Student's t test; ** statistically significant difference [P < 0.01]).
(D) Stomata closure rates of the wild type and lew1. For lew1 plants, stomata from wilting parts were measured. About 40 stomata were measured in each of three experiments for both the wild type and lew1. Data are means ± se (Student's t test; ** statistically significant difference [P < 0.05]).
(E) Stomata comparison between the wild type and lew1. The stomata on the wilting part of a leaf are shown. Bars = 20 μm.
(F) Comparison of stomata in the wild type and lew1 under conditions that promote full stomatal opening. The stomata from the wilting part of a lew1 leaf were not open under conditions when all stomata in the wild-type leaf were open. Bars = 20 μm.
(G) Comparison of stomata in the wild type and lew1. Stomata on nonwilting parts in the leaf base of lew1 are shown. Bars = 20 μm.
(H) Osmotic potential in the wild type and lew1 under normal growth conditions. Values are means ± se, n = 3 (Student's t test; * statistically significant difference [P < 0.05]).
(I) Comparison of leaf electrolyte leakage between lew1 and the wild type. Values are means ± se, n = 3 (Student's t test; * statistically significant difference [P < 0.05]).
(J) Typical recording trace showing measurements of turgor in epidermal cells of a wild-type leaf. Following successful impalement of a cell with the pressure probe, the intracellular recording was continued until a stationary turgor was reached. The trace shows successive recordings in three individual cells.
(K) Mean (±se) epidermal cell turgor in areas of leaves of wild-type and lew1 plants showing no obvious sign of wilting (wild type, n = 22 cells; lew1, n = 21 cells). There is a statistically significant difference (P = 0.0005) between the two genotypes.

