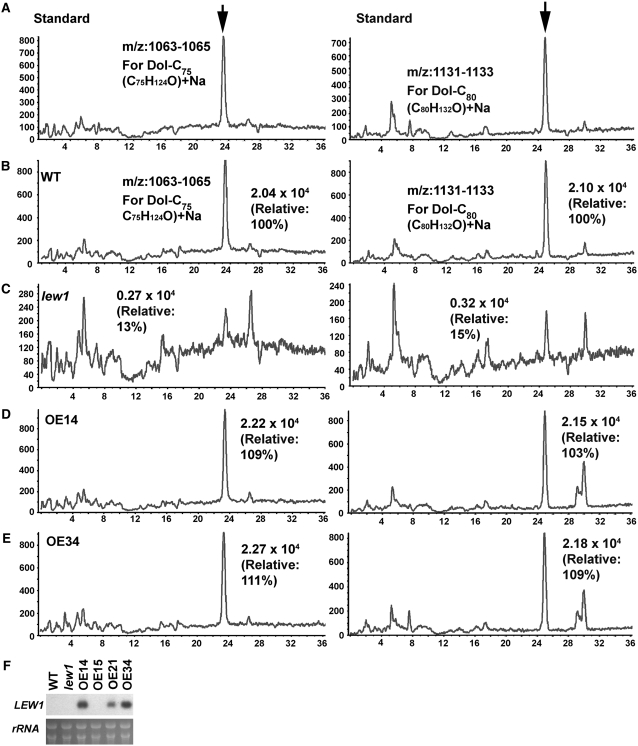
Figure 5.
Analysis of the Relative Dolichol Contents in Wild-Type, lew1, and LEW1 Overexpression Plants by LC-MS.
The peak area in the wild type was taken as 100%, and the relative contents in other plants were compared with that in the wild type.
(A) The dolichol standards (left, Dol-C75; right, Dol-C80). Arrows indicate the peaks.
(B) The wild type.
(C) lew1 mutant.
(D) Overexpression line 14 (OE14).
(E) Overexpression line 34 (OE34).
(F) RNA gel blot analysis of LEW1 expression in OE14 and OE34. Due to its low expression, LEW1 transcript could not be detected in the wild type and the lew1 mutant by RNA gel blot under the conditions used. OE15 and OE21, two other transgenic lines not used in this study, are also included. The bottom panel shows an RNA gel as a loading control.

