Figure 3.
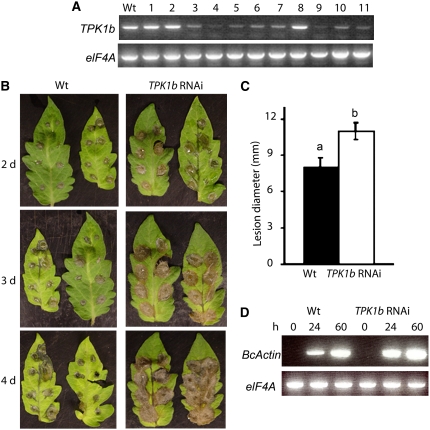
TPK1b Is Required for Resistance to Botrytis.
(A) RT-PCR from wild-type and TPK1b RNAi lines showing TPK1b transcript levels.
(B) TPK1b RNAi plants show increased susceptibility to Botrytis.
(C) Disease lesion size in Botrytis-inoculated leaves at 2 DAI.
(D) Accumulation of Botrytis ActinA mRNA as a measure of fungal growth in drop-inoculated leaves.
In (A), numbers above the lanes indicate independent RNAi transgenic lines, and the RNA used for the RT-PCR was extracted from Botrytis-inoculated leaves. In (C), the values represent the mean ± se from a minimum of 60 lesions. Analysis of variance and Duncan's multiple range test were performed to determine the statistical significance of the differences in the mean disease lesion sizes using SAS software (SAS Institute, 1999). Bars with different letters are significantly different from each other at P = 0.05. In (D), RT-PCR was performed using the Botrytis ActinA gene-specific primers. Experiments were repeated at least three times with similar results. h, h after inoculation; d, days after inoculation; BcActin, B. cinerea ActinA gene.

