Figure 1.
Auxin-Responsive Reporter Genes Are Transcribed in Anthers before the Onset of Late Developmental Programs and Are Induced by Exogenous Auxin.
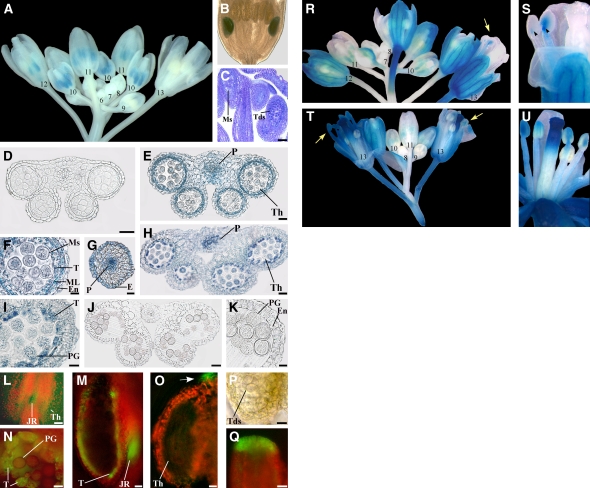
(A) to (C) Expression of the DR5:GUS auxin-responsive reporter in flowers at different developmental stages.
(A) DR5:GUS inflorescence showing no GUS staining in flower buds at early stages of development (6 to 9), intense GUS staining (blue) in anthers at stages 10 and 11, GUS staining at stage 12 only in short stamens, and no GUS staining at stage 13. Numbers indicate flower developmental stages.
(B) DR5:GUS flower bud at early stage 12: GUS staining is observed in the anthers of short stamens.
(C) Longitudinal section of a DR5:GUS flower bud at stage 10: microspores are visible in the anthers of long stamens, whereas tetrads are visible in those of short stamens. Bar = 30 μm.
(D) to (K) Histochemical analysis of anthers in transection of DR5:GUS stamens.
(D) Anther at stage 9. GUS staining is absent at the onset of meiosis. Bar = 20 μm.
(E) Anther at late stage 10. Strong GUS staining at the end of meiosis in the theca and procambium. Bar = 20 μm.
(F) Detail of (E). Strong GUS staining in the tapetum, middle layer, endothecium, and in microspores. Bar = 10 μm.
(G) Upper stamen filament at late stage 10: transverse section at the end of meiosis showing intense GUS staining in the procambium and epidermal cells. Bar = 20 μm.
(H) Anther at stage 11. GUS staining is observed in the theca and procambium. Bar = 20 μm.
(I) Detail of (H). GUS signal is localized in tapetum degenerating cells and in pollen grains. Bar = 10 μm.
(J) Anther at stage 12. GUS staining is absent after septum lysis (bilocular anther). Bar = 30 μm.
(K) Detail of (J). GUS signal is absent in the endothecium and pollen grains. Bar = 10 μm.
(L) to (Q) Fluorescence and bright-light images of anthers and pistils of DR5:GFP auxin-responsive reporter at different developmental stages.
(L) Stamen at late stage 10. GFP fluorescence (green) is visible in the theca and in the junction region between anther and filament. Bar = 80 μm.
(M) Stamen at late stage 11. Hand-cut longitudinal section showing intense GFP fluorescence in the remnants of the tapetum and in the junction region between anther and filament. Bar = 20 μm.
(N) Anther theca at late stage 11. Hand-cut transverse section showing intense GFP fluorescence in tapetum degenerating cells and faint fluorescence in pollen grains. Bar = 10 μm.
(O) to (Q) Anther and pistil at late stage 9.
(O) Anther theca in longitudinal section showing GFP fluorescence at the tip of the anther (arrow) but not in the theca. Bar = 10 μm.
(P) Detail of (O) in bright light showing tetrads. Bar = 10 μm.
(Q) Detail of the apical region of the pistil. GFP fluorescence is intense in cells differentiating the papillae. Bar = 20 μm.
(R) to (U) Expression of the DR5:GUS reporter after 10 mM NAA treatment of in planta inflorescences ([R] and [S]) or excised inflorescences ([T] and [U]).
(R) DR5:GUS inflorescence showing no GUS staining in flower buds at early stages of development (7 and 8), intense GUS staining in anthers at stages 10 and 11, and GUS staining in stamens at stage 13 (arrow). Numbers indicate flower developmental stages.
(S) Detail of (R) flower at stage 13: GUS signal is observed in filaments and in the junction region between anther and filament (arrowheads).
(T) DR5:GUS inflorescence showing no GUS staining in flower buds at early stages of development (8 and 9), intense GUS staining in anthers at stages 10 and 11, and intense GUS staining in stamens at stage 13 (arrows). Numbers indicate flower developmental stages.
(U) DR5:GUS flower at late stage 12: GUS signal is observed in filaments and anthers.
E, epidermal cells; En, endothecium; JR, junction region; ML, middle layer; Ms, microspores; P, procambium; PG, pollen grains; T, tapetum; Tds, tetrads; Th, theca.

