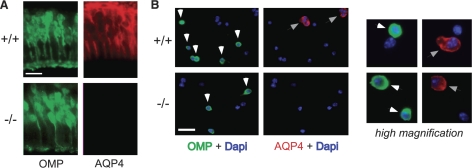
Figure 4.
AQP4 expression in olfactory epithelium. A) OMP (ORN marker, green) and AQP4 (red) immunofluorescence of OE from wild-type and AQP4-null mouse (apical surface facing down). B) Immunofluorescence of dissociated cells. Left panels: low-magnification images showing green-stained ORNs (white arrows) and red-stained AQP4-expressing cells (gray arrows). Right panels: high-magnification images showing examples of individual cells stained green or red only (top) and one example of a cell stained green and red (bottom). Scale bars = 10 μm (A); 50 μm (B).

