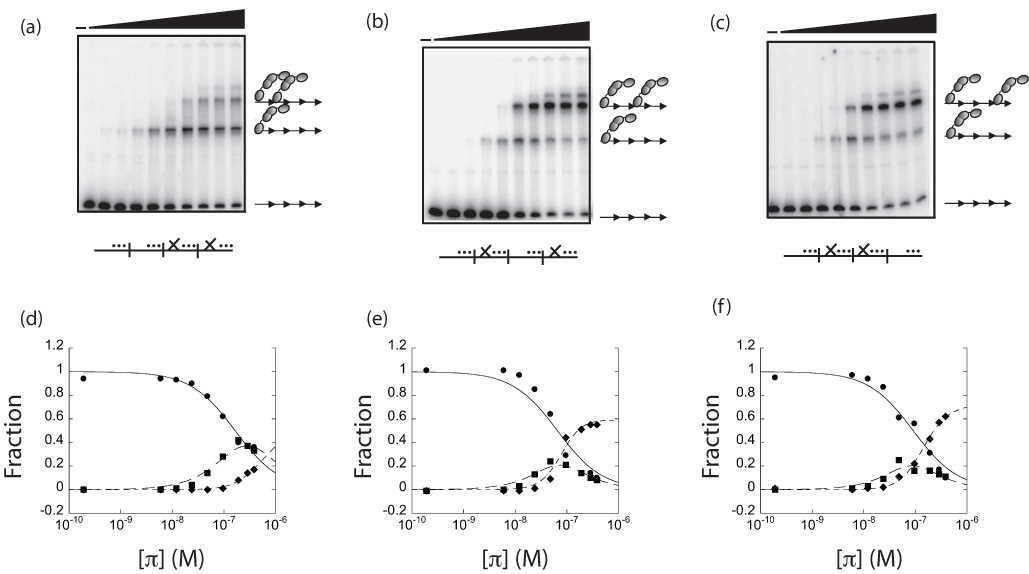
π binds with greater cooperativity to alternate iterons than adjacent iterons
in vitro. (a–c) Gel shift titrations of purified π with the depicted probes. (
_…) represents an iteron with mutations only in the 14
th, 17
th, and 18
th iteron, which is dimer proficient and monomer deficient. (
X…) represents an iteron with mutation in the 7
th, and 9
th bp as well as the 14
th, 17
th, and 18
th, bp, which cannot bind monomers or dimers. The first lane is DNA only. Black triangles represent increasing levels of π•wt, starting with 3.12 ng (in a 15 □L reaction) and doubling for each lane. DNA probe preparation and gel shift titrations were carried out exactly as previously described
33 except that: 110 pg labeled iteron-containing probe was used in the binding reactions and Promega (Madison, WI) 6X loading dye was added prior to loading the gel. Arrows represent iterons. Gray double-ovals represent π dimers. (d–f) Quantification of gel shift titration data in panels (a–c), respectfully. The fraction of the total radioactivity as free DNA (circles), DNA containing a single π dimer (squares), and DNA containing two π dimers (diamonds) was quantified by fitting data from the gel shift titrations to the following equations using KaleidaGraph software (Reading, PA). The following equations were based on a modified statistical mechanical approach.
33,
35,
40
θ
o,θ
1,and θ
2 are fractions of free DNA, single dimer complex, and two dimer complexes, respectively. P
0 and P
max are the baseline and maximum fraction for a given titration.
Z is the binding polynomial and is equal to 1 +
K1L +
K2L2.
L is protein concentration,
K1=(
k1 +
k2) and
K2=(
k1k2k12).
k1 and
k2 are the binding affinity constants for the first iteron and the second iteron of the 2-iteron complex, and
k12 is the cooperativity coefficient describing the interaction of protein molecules occupying both sites. Broken, dotted and continuous lines correspond to the best fit of the data for equations (
1a–
1c), respectively. Once
K1 and
K2 were obtained from the least squares linear regression analysis,
k12 was derived by a few simple rearrangements, as described previously.
33

