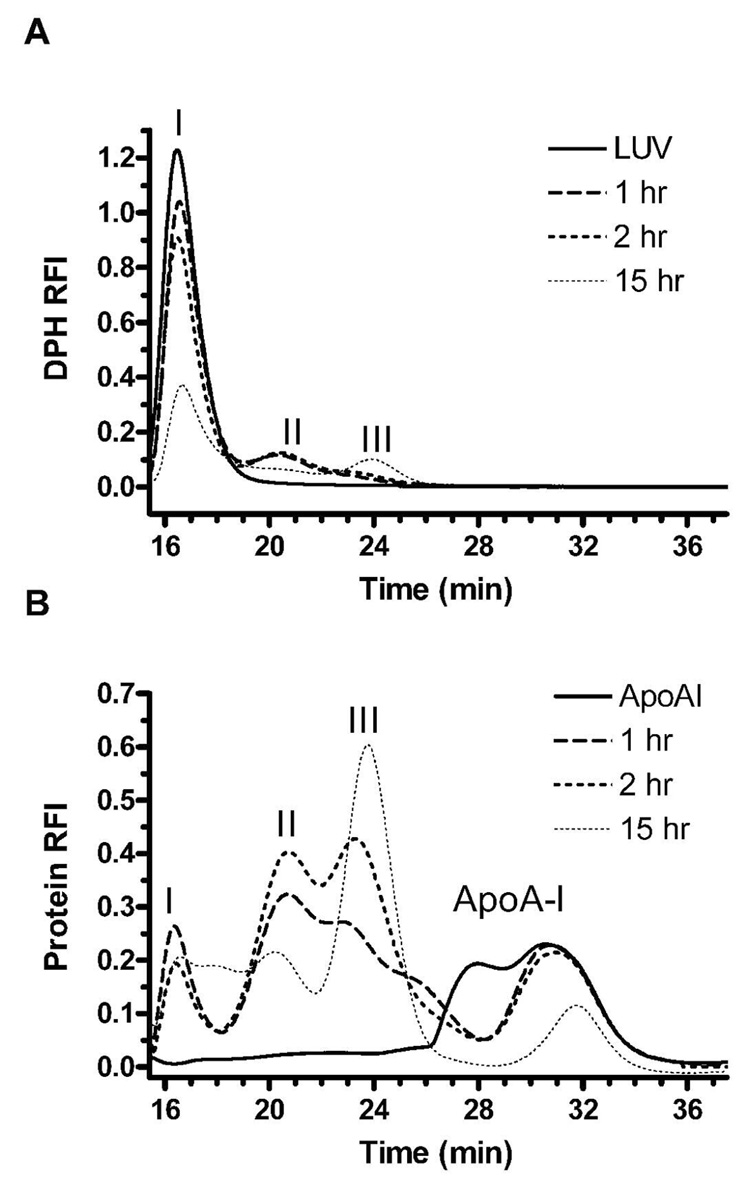
Figure 1.
Time course of apoA-I DMPC complex formation followed by gel filtration detected by DPH fluorescence (A) and protein fluorescence (B), respectively. LUVs (1.8 mM DMPC) and 18 µM rh-apoA-I (100:1 mole ratio) mixtures were incubated for 1 (dashed line), 2 (dotted line), or 15 (thin dotted line) hrs at 23°C and applied immediately to the Superdex 200 column. The elution pattern of DMPC LUVs alone (solid line in panel A) and apoA-I alone (solid line in panel B) are also shown. Real time DPH fluorescence was detected by an in-line monitor using excitation and emission wavelengths of 357 nm and 427 nm respectively. Real time protein fluorescence was detected using excitation and emission wavelengths of 280 nm and 340 nm, respectively.

