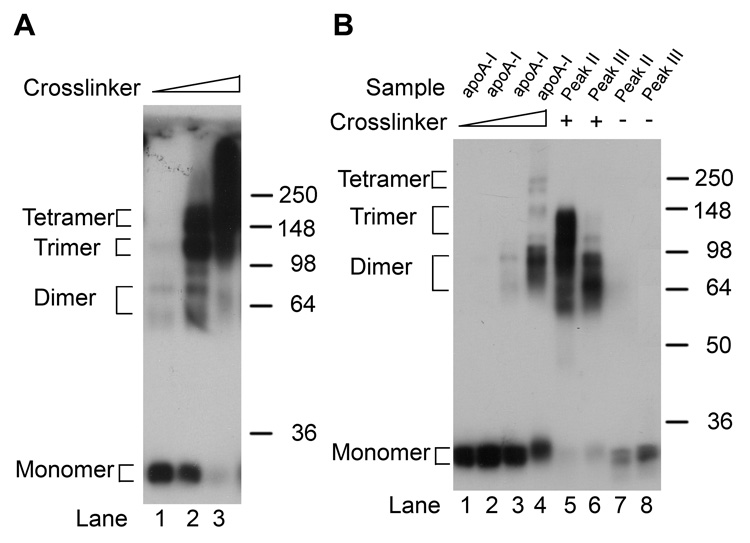
Figure 4.
Cross linking analysis of lipid-free apoA-I and apoA-I DMPC complexes. A. Concentrated lipid-free apoA-I at 70 µM, was incubated with the DSS cross linker at 1x (lane 1), 5x (lane 2) and 20x molar ratios (lane 3), respectively. 150 ng of each product was analyzed by SDS PAGE and western blot analysis. The positions of the monomer, dimers, trimers, and tetramers are denoted. B. Lipid-free apoA-I, and isolated peak II and peak III complexes were adjusted to a final apoA-I concentration of 0.85 nM. Lanes 1–4, the low concentration of apoA-I was reacted with 0, 2.5x, 20x, and 200x molar ratio of the DSS cross linker, respectively. Lanes 5 and 6, peaks II and III, respectively, were reacted with the DSS cross linker at DSS to apoA-I molar ratio 200. Lanes 7 and 8, peaks II and III were incubated in the absence of DSS cross linker. 100 ng of each product was analyzed by SDS PAGE and western blot analysis.

