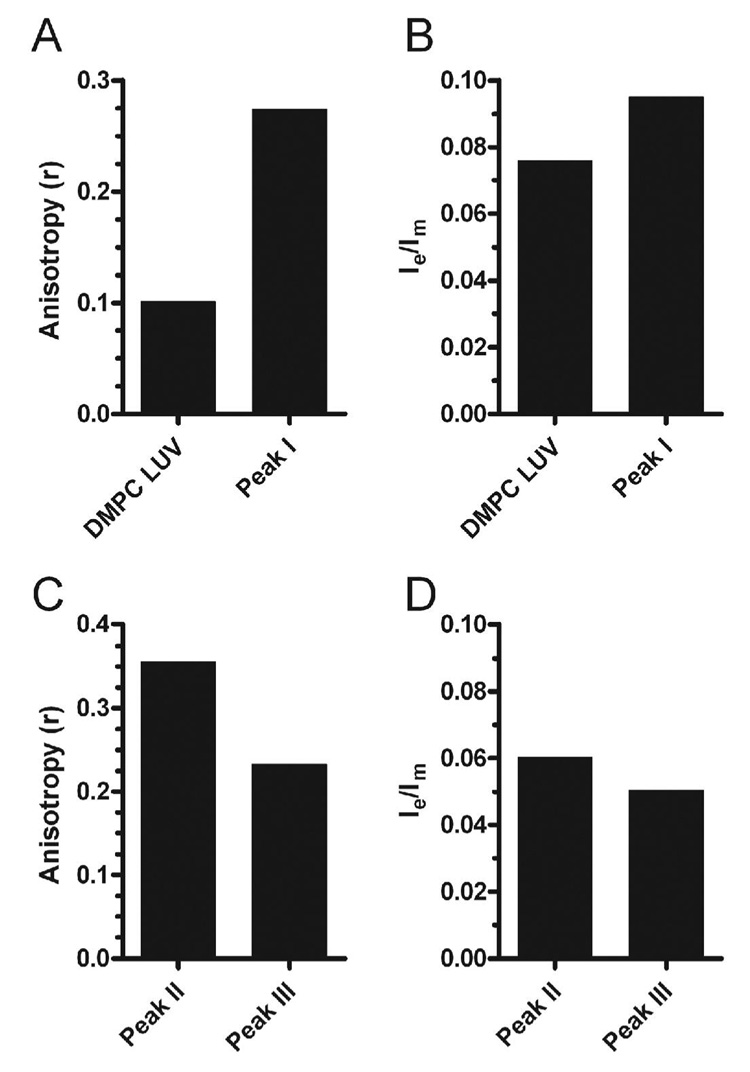
Figure 7.
Lipid fluidity and domains of DMPC LUVs and apoA-I lipid complexes. A. Anisotropy (r) of DPH labeled DMPC LUVs and of the LUV sized particles isolated in peak I after gel filtration of a 2 hour incubation of 1.8 mM DMPC (DPH-labeled) LUVs with 18 µM rh-apoA-I. B. Pyrene excimer to monomer ratio (Ie/Im) of PPDPC labeled DMPC LUVs and in the LUV sized particles isolated in peak I after gel filtration of 2 hour incubation of 1.8 mM DMPC (PPDPC-labeled) LUVs with 18 µM rh-apoA-I. C. Anisotropy (r) of peak II and peak III, respectively, after gel filtration of a 2 hour incubation of 1.8 mM DMPC (DPH-labeled) LUVs with 18 µM rh-apoA-I. D. Pyrene excimer to monomer ratio (Ie/Im) of peak II and peak III, respectively, after gel filtration of a 2 hour incubation of 1.8 mM DMPC (PPDPC-labeled) LUVs with 18 µM rh-apoA-I. Anisotropy data is the mean of three 10-second integrated readings with a standard deviation of <1%. The Ie/Im data is based upon the mean of three emission wavelength scans, with an instrument standard deviation of 7%.

