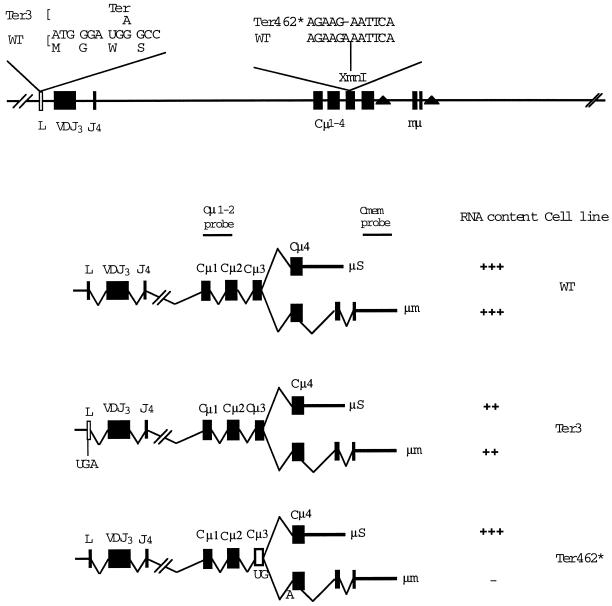
Figure 1.
Production of μ mRNA. The diagram indicates the structure of the μ gene and its relationship to the μs and μm forms of mRNA. The filled triangles indicate the poly(A) addition sites, which function in these two forms of μ mRNA. The position of the nonsense codons in the gene and their effects on μs and μm mRNA are shown. This diagram also shows the origin of the probes used in measuring μm and μs RNA. The Cμ1-2 probe corresponds to the 0.9-kb XbaI–BamHI fragment. The μm-specific probe corresponds to the 0.9-kb XbaI–KpnI fragment.

