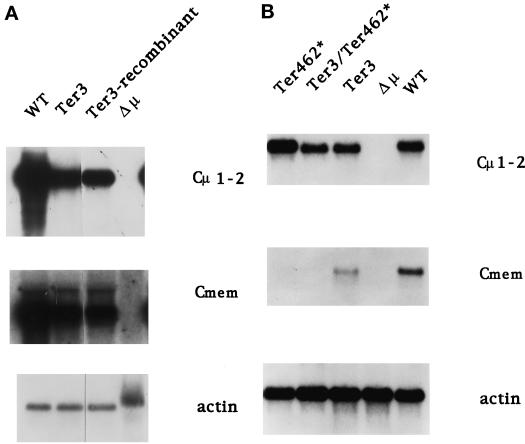
Figure 3.
Analysis of μs and μm RNA. RNA was isolated from the indicated cell lines and analyzed by Northern blot using probes for Cμ1-2, Cmem, (Figure 1), and actin. (A) Comparison of the original Ter3 mutant with the Ter3 recombinant (Figure 2). (B) Typical results of experiments to measure the effects of Ter462* on μ mRNA. The WT, Δμ, Ter3, and Ter462* lanes correspond to the original hybridoma and mutant cell lines (see MATERIALS AND METHODS). The Ter3/Ter462* lane corresponds to the recombinants illustrated in Figure 2. The radioactivity in the bands was quantified by PhosphorImager analysis (see Table 1). In related experiments the frame shift mutation U26, which is a 1-bp deletion 39 nucleotides 5′ of the igm482 mutation and creates the same terminator at codon 462, behaved like igm482 in depressing the level of μm but not of μs. The actin band from Δμ is diffuse and more slowly migrating because of DNA present in this preparation.

