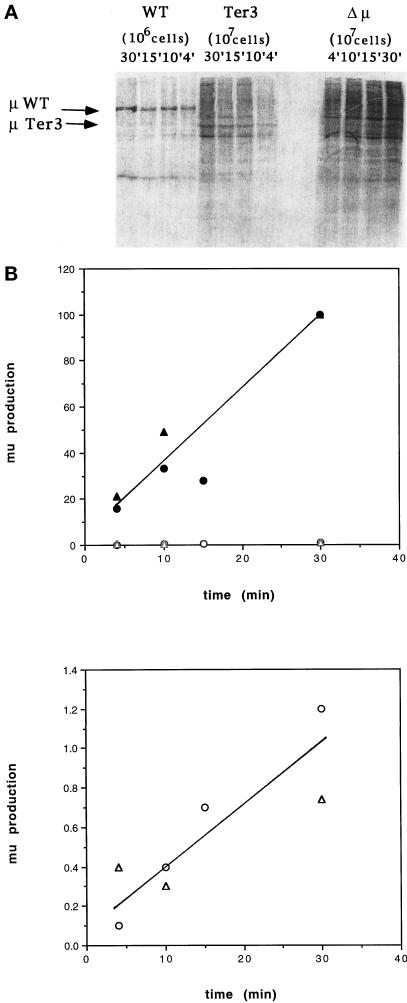
Figure 5.
Kinetics of μ production. (A) The indicated cell lines (2 × 10⁷ cells) were incubated in [35S]methionine-containing medium for various intervals. μ chains were analyzed by SDS-PAGE and then visualized by PhosphorImager. As described in Figure 4, 107 cell equivalents were analyzed in the case of mutant cell lines, and 106 cell equivalents were analyzed for the wild type. (B) PhosphorImager results presented in Table 2. Upper panel, results for both wild type (filled symbols) and Ter3 (open symbols); lower panel, Ter3 results on an expanded scale to show the nearly linear incorporation. Two independent experiments are plotted: the circles and triangles correspond to experiments 1 and 2 (Table 2), respectively.

