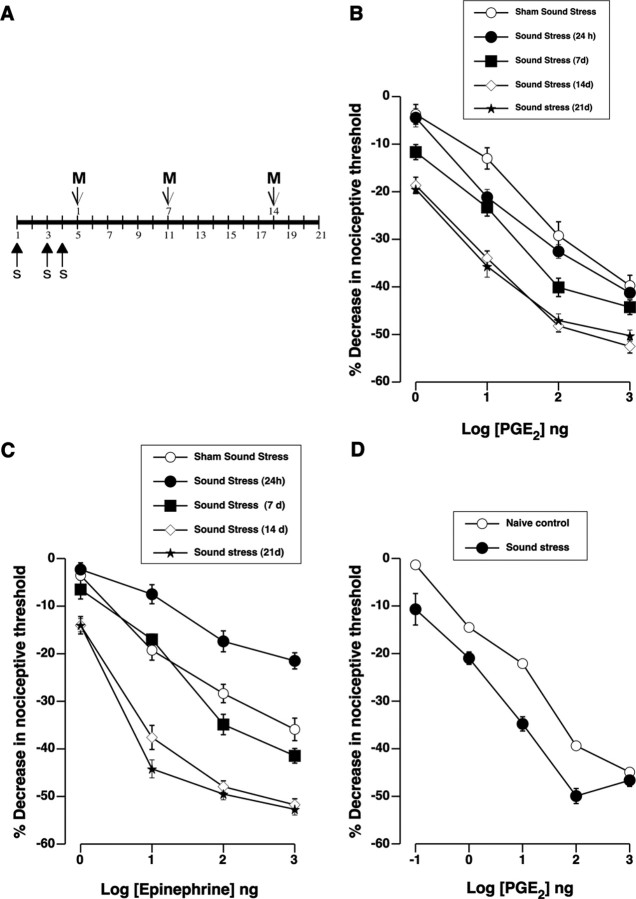
Figure 1.
Sound stress enhances hyperalgesia induced by prostaglandin E2 and epinephrine. A, A 4 d cycle of sound stress consists of 30 min of intermittent exposure to sound stress (s) administered on days 1, 3, and 4. Pain threshold measurements (M) were taken on poststress days 1, 7, 14, and 21. B, C, Dose–response relationships for PGE2- and epinephrine-induced hyperalgesia were determined after exposure to sound stress or sham (exposure to the sound stress device without sound). Logarithmically increasing doses of PGE2 or epinephrine were administered cumulatively as indicated. B, Changes in PGE2 hyperalgesia produced by sound stress exposure. There was a significant main effect of group for sound stress on PGE2 hyperalgesia (F(4,261) = 29.70; p < 0.001). Post hoc analysis showed that PGE2 hyperalgesia in the group of rats that was tested 14 d (n = 24) or 21 d (n = 12) after sound stress was significantly enhanced (p < 0.001 each) compared with the sham sound-stressed group (n = 20). PGE2 hyperalgesia in the rest of the groups was not significantly different from the sham-stressed group (p > 0.05). C, Effect of stress on epinephrine hyperalgesia. There was a significant main effect of sound stress on epinephrine hyperalgesia compared with the sham sound stress group (F(4,207) = 110.70; p < 0.001). Post hoc analysis showed that epinephrine hyperalgesia in the group of rats that was tested 24 h after sound stress (n = 22) was significantly less (p < 0.001) than in the sham-stressed group (n = 12). However, 14 d (n = 12) or 21 d (n = 12) after sound stress, epinephrine hyperalgesia was significantly enhanced compared with the sham sound-stressed group (p < 0.001). D, Dose–response relationship for PGE2 in the gastrocnemius muscle in naive rats and 14 d after sound stress. Repeated-measures ANOVA showed a significant difference in the response of gastrocnemius muscle to PGE2 between naive and sound-stressed rats (F(1,55) = 53.2; p < 0.001; n = 12 each). Error bars indicate SEM.

