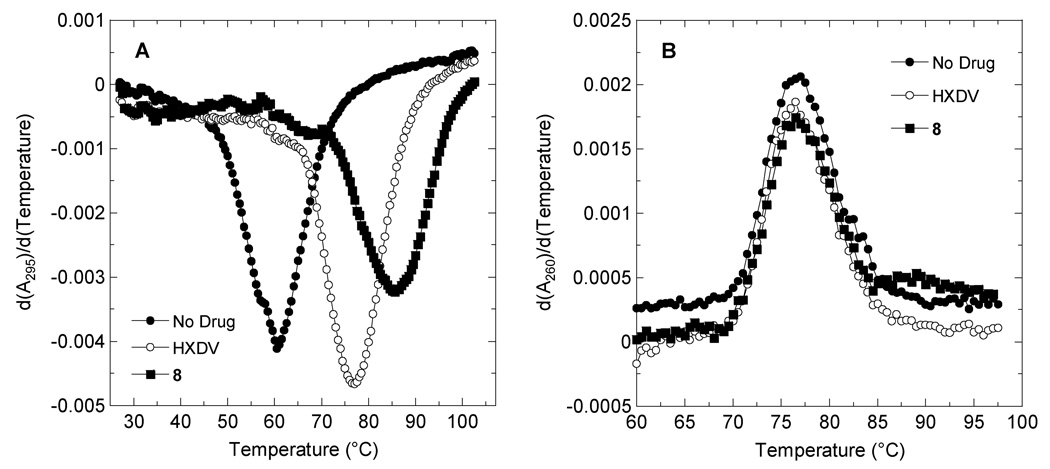
Figure 2.
First derivatives of the UV melting profiles of d[T2G3(T2AG3)3A] (A) and ST-DNA (B) in the absence and presence of HXDV or compound 8. Profiles were acquired on an AVIV model 14NT-UV-VIS spectrophotometer using quartz cuvettes with a 1 cm pathlength. The temperature was raised in 0.5 °C increments and the samples were allowed to equilibrate for 1.5 minutes at each temperature setting, whereupon absorbances were recorded over a period of 5 seconds and averaged. When present, ST-DNA was used at a base pair concentration of 15 µM, while d[T2G3(T2AG3)3A] was used at a strand concentration of 4 µM. Macrocyclic ligands were used at a concentration of 15 µM in the ST-DNA experiments and 20 µM in the d[T2G3(T2AG3)3A] experiments. The solution conditions were 10 mM EPPS (pH 7.5) and sufficient KCl to bring the total K+ concentration to 50 mM. In the ST-DNA experiments, the acquisition wavelength was 260 nm, while being 295 nm in the d[T2G3(T2AG3)3A] experiments.

