Fig. 3.
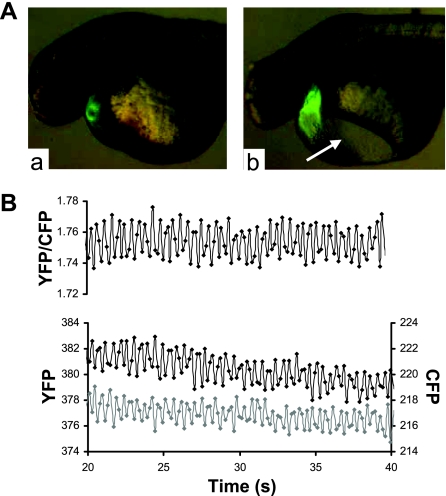
FRET measurements from intact transgenic zebrafish embryos. A: epifluorescent images of control (a) and tnnt2 morpholino-injected (b) transgenic zebrafish embryos expressing YFP-CBD1-CFP at 2 days postfertilization. Arrow indicates the presence of pericardial edema in morpholino-injected fish. B: representative recording of changes in YFP (black) and CFP (gray) emission and the YFP-to-CFP ratio in an intact tnnt2 morpholino-injected YFP-CBD1-CFP transgenic zebrafish. Data were collected at 6 frames/s with a ×20 oil immersion lens.

