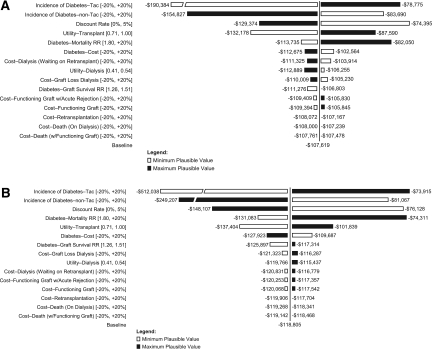
Figure 2.
One-way sensitivity analysis of changes in the incremental cost per QALY. (A) Cost-effectiveness of SRL+ST versus MMF+Tac+ST. (B) Cost-effectiveness of MMF+CsA+ST versus MMF+Tac+ST. Tornado diagrams examine the changes in cost-effectiveness across the range of plausible values for each input.

