
Figure 3.
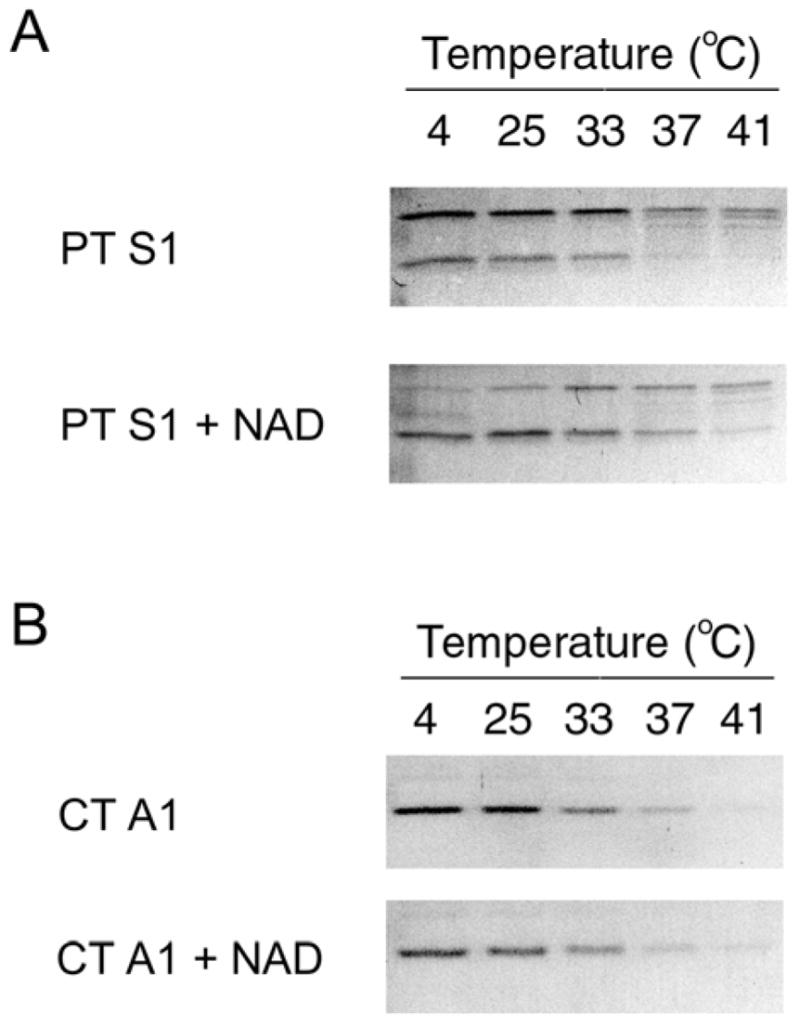
Effect of NAD on PT S1 Protease Sensitivity. PT S1 (A) and CT A1/CT A2 (B) were placed in 20 mM Na-phosphate buffer (pH 7.0) containing 10 mM β-ME. 1 mM NAD was present in the Na-phosphate buffer as indicated. Toxin samples were incubated at the stated temperatures for 45 min and then shifted to 4°C for 10 min. Thermolysin was added for another 45 min at 4°C. Samples were visualized by SDS-PAGE with Coomassie staining. In panel A, the upper band is full-length PT S1 and the lower band is the S1 fragment. In panel B, the 5 kDa CT A2 polypeptide was not visible after Coomassie staining.