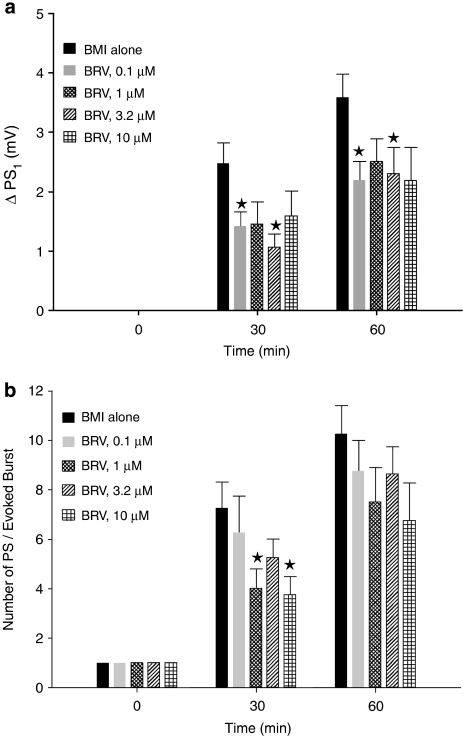
Figure 5.
Effect of brivaracetam (BRV) on ΔPS1 (a) and repetitive PS number (b) in rat hippocampal slices in the presence of BMI. As shown in Figures 3a and b, the bars represent mean value±s.e.mean, averaged over the slices in each group (n=8 per group), the individual value for each slice at every given time point being calculated on line on the average of three successive samples of field potentials, evoked at about 0.1 Hz. *P<0.05 compared to control (BMI alone). BMI, bicuculline methiodide; PS, population spike; ΔPS1, increase in amplitude of the first (and largest) population spike.

