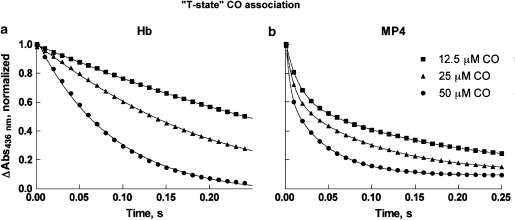
Figure 3.
‘T-state' normalized time courses of CO association to Hb (a) and MP4 (b). Time courses were measured by mixing the deoxygenated Hbs (6 μM in haem before mixing) with buffer containing CO at 100, 50 or 25 μM before mixing. Only data sampled every 10 ms are shown for clarity. The solid lines show fits of the data using Equation (3). Fitted rates are given in Table 1. CO, carbon monoxide.

