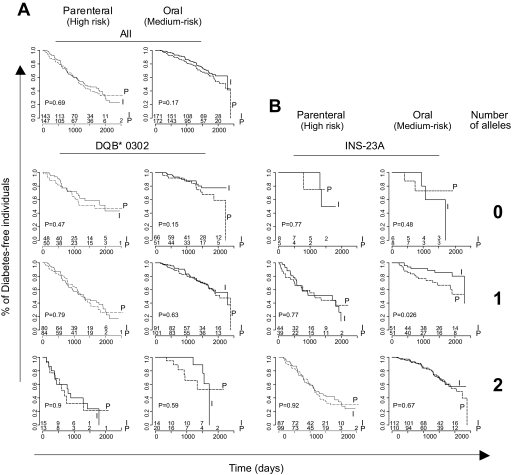
FIG. 3.
Response to treatment according to HLA-DQB1 and INS-23 genotype. A: All 638 individuals were stratified according to the number of HLA-DQB1*0302 alleles and treatment group. Significance of differences in survival is evaluated by log-rank test. I, intervention group; P, placebo/observation. B: Individuals were stratified based on the number of INS-23A risk alleles.

