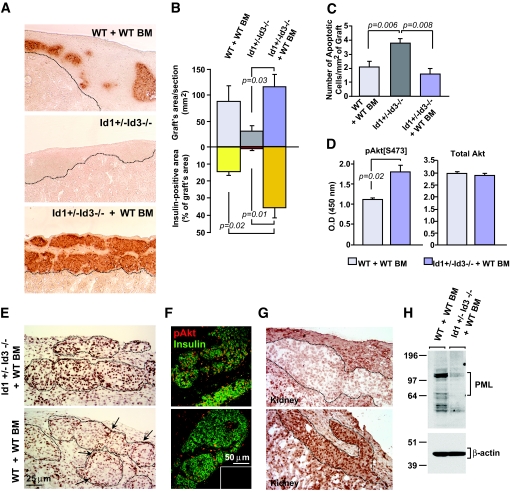
FIG. 1.
Rescue of transplant engraftment in Id1+/−Id3−/− mice by reconstitution with wild-type bone marrow is associated with the activation of islet cell survival signals. A: Graft tissue sections at 1 week after transplantation stained by immunoperoxidase for insulin (brown). Scar tissue occupies the transplantation site in untreated Id1+/−Id3−/− mice (middle panel, area bordered by dotted line), indicating failure of islet engraftment. In contrast, grafts containing insulin+ cells are present in bone marrow–reconstituted wild-type and Id1+/−Id3−/− mice (top and bottom panels). B: Morphometric analysis of whole grafts (top graph) and insulin+ areas (bottom graph) measured in multiple sections collected at 100-μm intervals throughout the grafts as described in research design and methods. Each bar represents the mean ± SE of measurements from 80–120 tissue sections per group with n = 4 mice/group. C: Quantitative analysis of apoptotic cells detected by TUNEL at 1 week after transplantation. Values are means ± SE of measurements from n = 3 mice per group. Statistical significance by t test is indicated. Significance was also validated by ANOVA and Bonferroni post hoc test (online appendix). D: Quantitative determination of pAkt[S473] (left) and total Akt (right) detected by ELISA in lysates of islet clusters microdissected from the grafts. Values are means ± SE of triplicate samples from a pool of n = 2 grafts per group. E: Tissue sections stained for pAkt[S473] by immunoperoxidase. In bone marrow–reconstituted Id1+/−Id3−/− (top panel), virtually all cells within islet cell clusters (dotted areas) express high levels of pAkt[S473], whereas in wild-type mice (bottom panel), only cells at the periphery of the clusters (arrows) are strongly positive for pAkt[S473]. F: Confocal microscopy of tissues sections stained by two-color immunofluorescence for pAkt[S473] (red) and insulin (green). Most insulin+ cells are pAkt+ in bone marrow–reconstituted Id1+/−Id3−/− mice (top panel), whereas fewer insulin+ cells express pAkt in wild-type controls (bottom panel). Inset represents background staining by control IgGs. Immunostainings are representative of n = 3 grafts. G: Tissue sections stained for PML by immunoperoxidase. Weak expression of PML in nuclei and cytoplasm of islet cells from the grafts of bone marrow–reconstituted Id1+/−Id3−/− (top panel) mirrors pAkt[S473] expression pattern. H: Western blotting of PML and β-actin in protein lysates of islet cell clusters microdissected from the grafts demonstrates differential expression of PML in wild-type and Id1/Id3-deficient mice. (Please see http://dx.doi.org/10.2337/db08-0244 for a high-quality digital representation of this image.)

