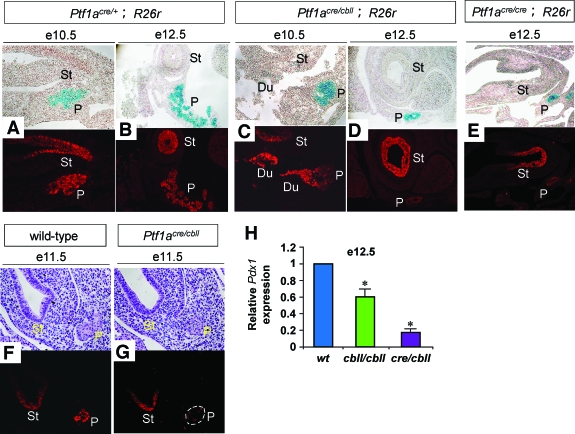
FIG. 7.
Pdx1 expression levels are reduced in early pancreatic precursors in Ptf1a hypomorphic mutant mice. A–E: Sections of pancreata stained with X-gal (blue) and Pdx1 (red). F and G: Sections of pancreata stained for hematoxylin and eosin (upper panels) and Pdx1 protein (lower panels). Signal intensity is similar in the distal stomach epithelium, so that the Pdx1 expression level in pancreatic precursors can be judged compared with it. Note that Pdx1 expression is reduced in pancreatic precursors at e10.5, e11.5, and e12.5 in Ptf1acre/cbll mice compared with Ptf1acre/+ and wild-type mice. G: Dashed line shows pancreatic epithelium. In Ptf1a null mice, Pdx1 expression is also reduced at e12.5 (E). H: Quantification of Pdx1 mRNA in pancreatic rudiments by real-time RT-PCR. The relative expression levels of Pdx1 in pancreatic rudiments from Ptf1a hypomorphic mice are shown compared with wild-type mice at e12.5. Data are represented as means ± SE (n = 4). *P < 0.05 compared with wild-type mice. Du, duodenum; St, distal stomach; P, pancreas. (Please see http://dx.doi.org/10.2337/db07-1558 for a high-quality digital representation of this figure.)

