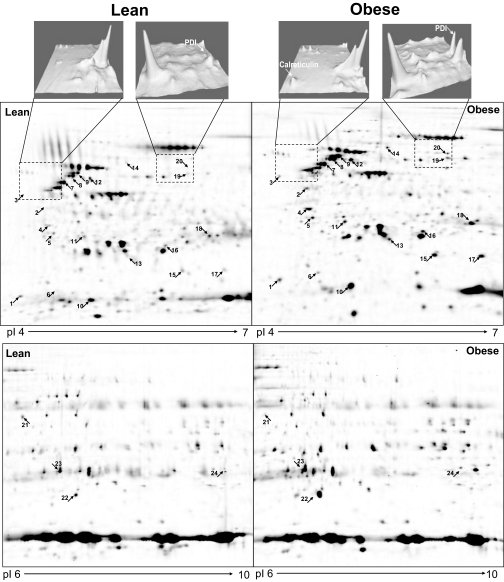
FIG. 1.
Expression levels of the UPR proteins CRT and PDI in adipose tissue of one lean and one obese subject (upper panels). Differentially expressed proteins in fat homogenates from one lean and one obese subject. Proteins were separated by isoelectric focusing and molecular weight (2-DG) as described in research design and methods. The subproteom from each sample was assessed using Pi ranges of 4–7 (middle panels) and 6–10 (lower panels). The proteins were stained with spyro-ruby and images compared by PD Quest software. The numbers correspond to the spot numbers in Table 2. The arrows indicate upregulated proteins in the fat of obese subjects.

