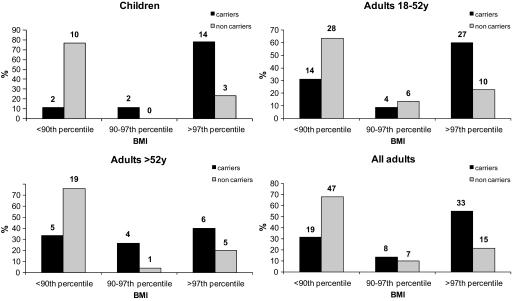
FIG. 2.
Distribution of individuals according to BMI. We used the official threshold of BMI, percentiles 90 and 97, to discriminate between lean, overweight, and obese subjects (21) within the 97 carriers and 81 noncarrier relatives from intrafamilial study. The absolute sample sizes of each subgroup are given above the bars.

