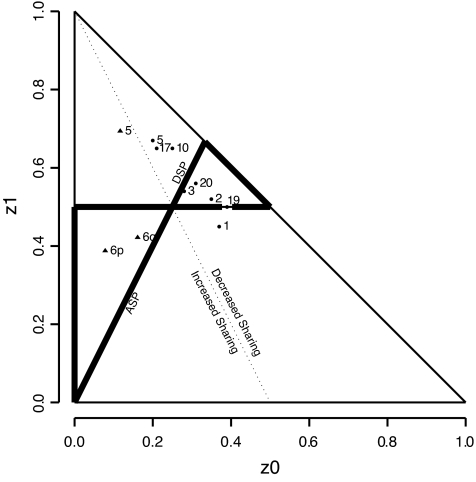
FIG. 3.
Sharing patterns for ASP (▴) and DSP (•) linkage peaks. Note that both ASP results on chromosome 6 and the DSP peaks for chromosomes 2, 3, 19, and 20 reside within the triangles defined by biological consistency under the respective models. The sharing pattern for the ASP peak on chromosome 5, for example, though comparatively distant from null sharing of 0.25, 0.5, and 0.25, is close to the dotted line defining mean sharing of one-half and is therefore not consistent with true linkage. The computations and the plot were obtained using SPLAT (16).

