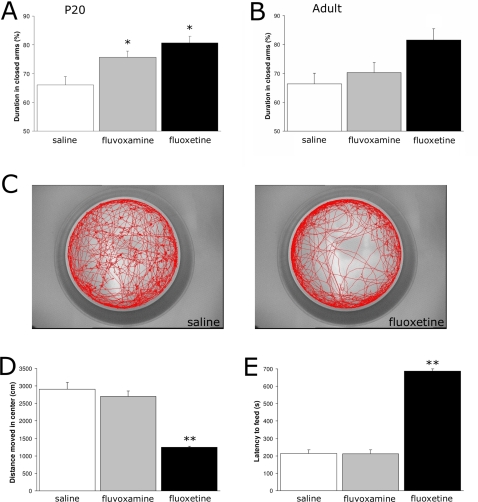
Figure 4. Behavioral data of the elevated plus maze (A, B), open field (C, D) and the novelty suppressed feeding test (E) presented as mean±S.E.M.
All behavioral test were performed with 3 groups: saline (white bars), fluvoxamine (gray bars) and fluoxetine (black bars). Panel C shows a typical example of a walking pattern in the open field (30 min) of a saline- and a fluoxetine-treated mouse. * p<0.05; ** p<0.01.

