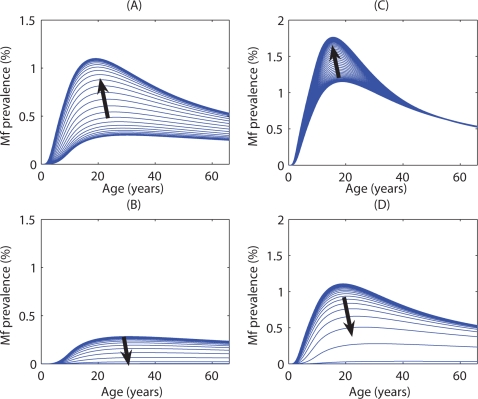
Figure 3. The direction of change of the Mf prevalence age-profile among human hosts when the intermediate host was culicine and the initial Mf prevalence was (A) above and (B) below the breakpoint value (0.21%) with a vector biting rate of 11 per month; and when the intermediate host was anopheline with initial Mf prevalence (C) above and (D) below the breakpoint value (0.82%) with a vector biting rate of 280 per month.
Each age-dependent curve represents a perturbation around the initial unstable equilibrium curve with the black arrows indicating the direction in which these curves are likely to travel on the way to the stable equilibrium.

