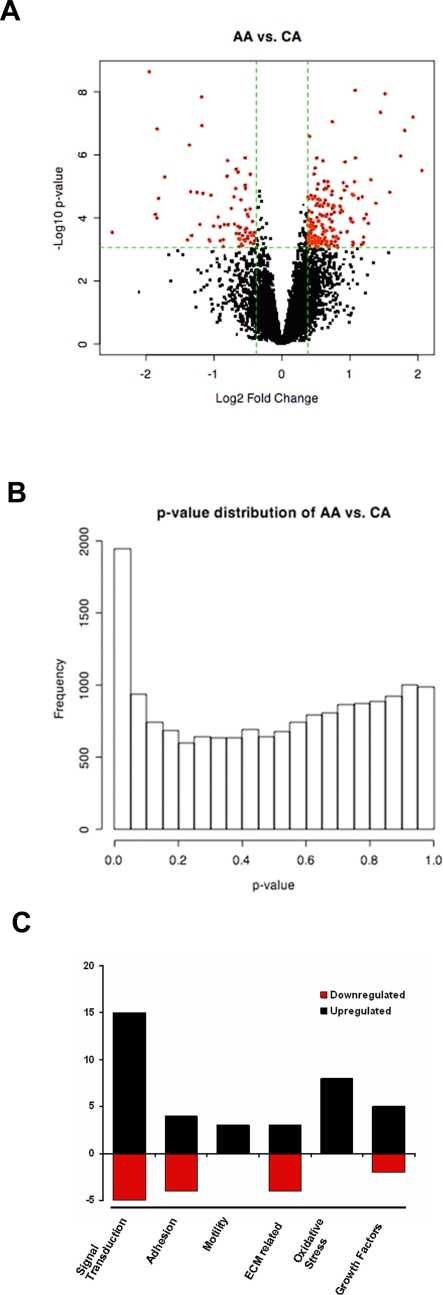
Figure 1. Differential gene expression in primary cultures of ONH astrocytes from age-matched normal donors (12 AA and 12 CA).
A. Volcano plot indicates the size of biological effect (fold change) versus the statistical significance of the result (statistical p-value). Volcano plot represents the total number of genes used in the analysis after removing ‘absent’ genes and redundant probes (10504) on the Affymetrix Human Genome HG U133A Chip. Each point represents a gene plotted as a function of fold change (Log2 (fold change), x-axis) and statistical significance (−Log 10 (p-value), y-axis). Vertical dotted lines represent fold changes of ±1.3, respectively. The horizontal dotted line represent FDR = 0.05 (p-value is 0.00086 for this data). The red dots represent 239 selected differentially expressed genes with FDR<0.05 and fold-change >1.3. B. Estimate of the proportion of genes differentially expressed among populations. The p-value distribution of AA-CA comparison shows that a number of genes have very small p-values, which are significant even after considering the effect of multiple testing through FDR adjustment. C. Changes in gene expression in major categories in AA astrocytes, compared to CA astrocytes. The x-axis is the selected categories: signal transduction, adhesion, motility, ECM related, oxidative stress and growth factors. The y-axis is the number of genes under the category from the differentiated gene list (Table 1). Red represents the number of genes downregulated in AA and black represents number of genes upregulated in AA.

