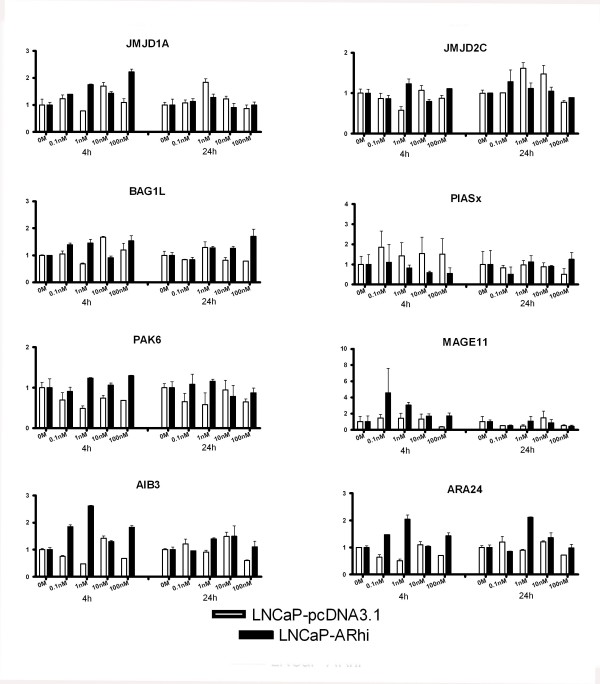
Figure 4.
The expression of JMJD1A, JMJD2C, BAG1L, PIASx, PAK6, MAGE11, AIB3, and ARA24 in LNCaP-pcDNA3.1 and LNCaP-ARhi at 4 and 24 hours according to Q-RT-PCR. The measurements were done in triplicates. The bars and whiskers represent mean + S.E.M. of each gene against the TBP, normalized against the 0 M of each time point. p-values are given in Table 1.

