
Figure 3.
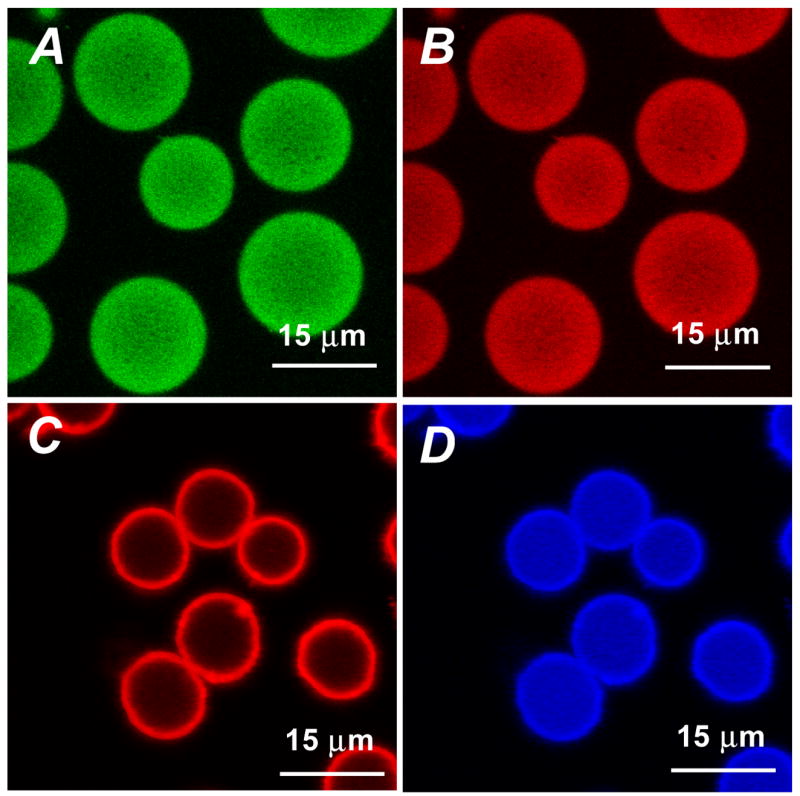
Confocal images depicting the distribution of FITC-GOx (A) and PtOEP (B) within algilica microparticles, obtained with sequential excitation at 488 and 543 nm. Images C and D are of completed sensors, depicting the location of fluorescent components – RITC-doped nanofilms (C) and PtOEP (D) – as obtained with 543 nm excitation.